Copyright
©The Author(s) 2018.
World J Gastroenterol. Mar 14, 2018; 24(10): 1167-1180
Published online Mar 14, 2018. doi: 10.3748/wjg.v24.i10.1167
Published online Mar 14, 2018. doi: 10.3748/wjg.v24.i10.1167
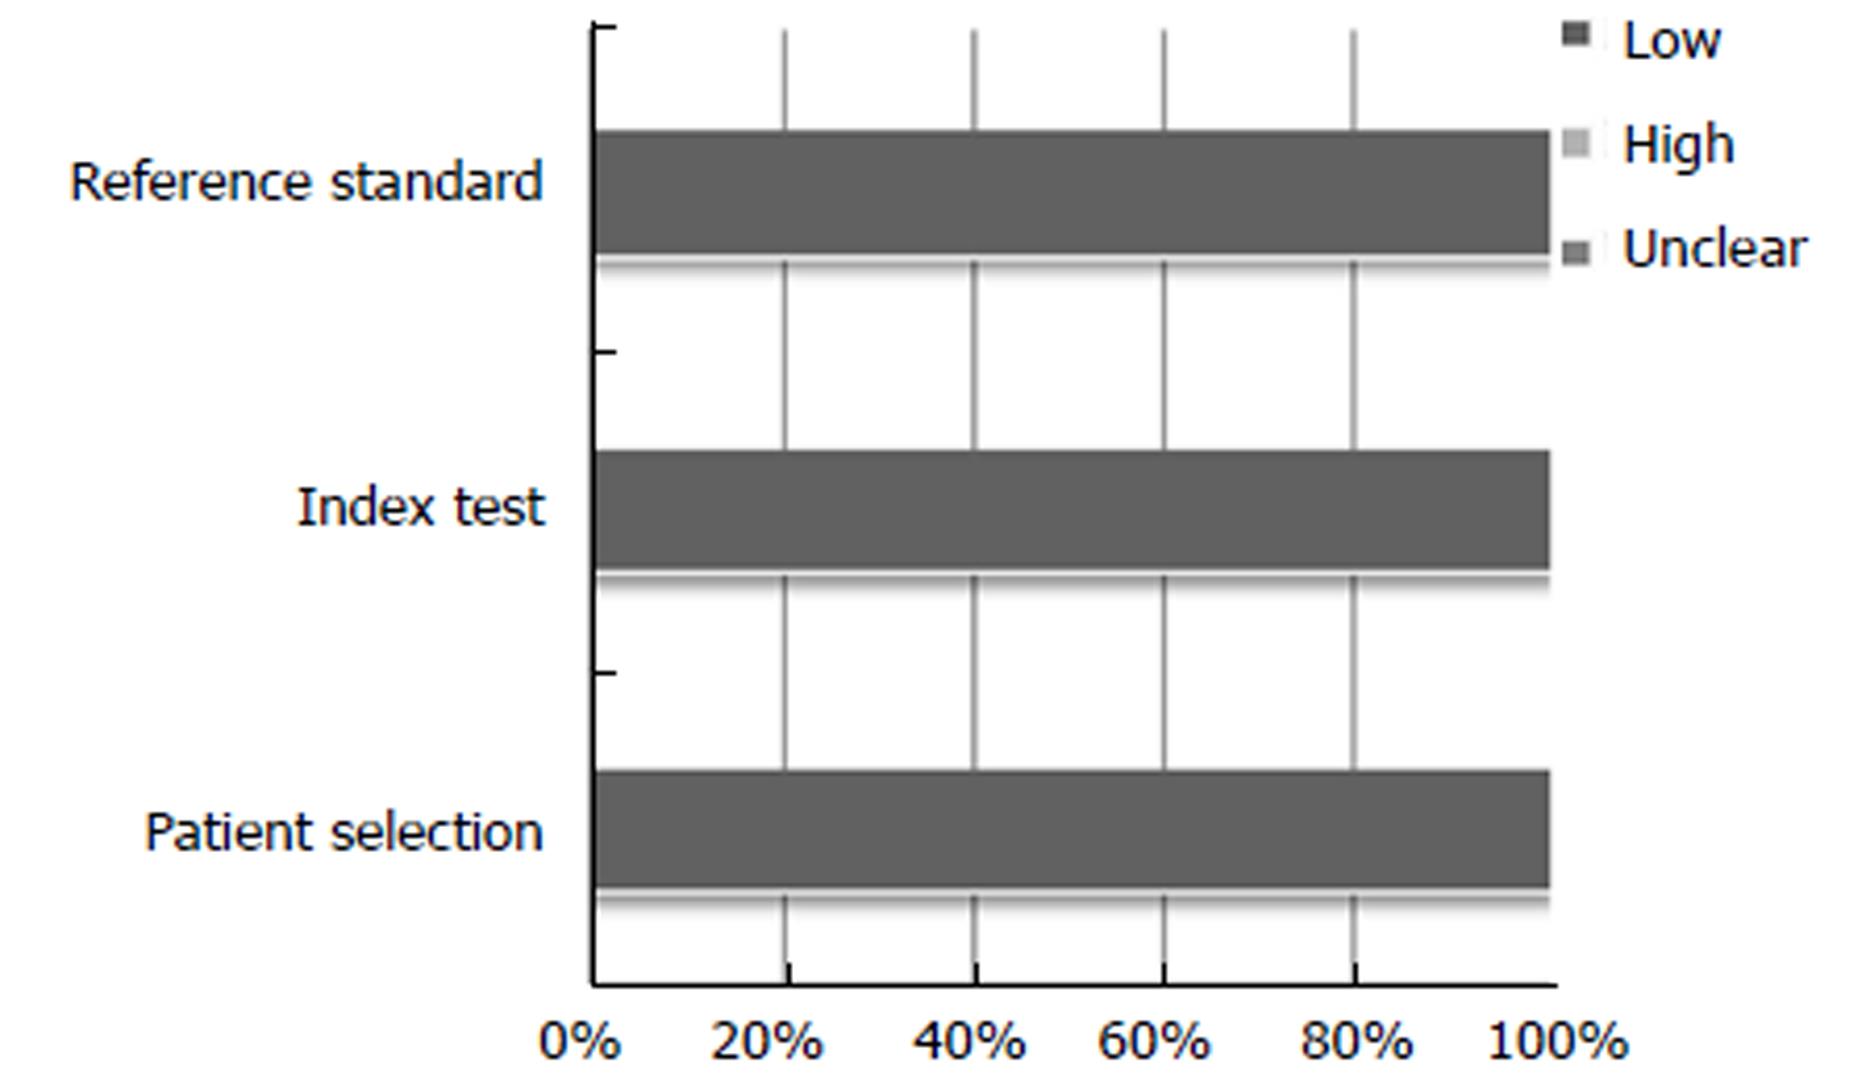
Figure 3 Stacked bar charts showing proportion of studies with low, high or unclear applicability.
Vertical axis represents the three domains of the quality assessment of diagnostic accuracy studies 2.
- Citation: Lord R, Burr NE, Mohammed N, Subramanian V. Colonic lesion characterization in inflammatory bowel disease: A systematic review and meta-analysis. World J Gastroenterol 2018; 24(10): 1167-1180
- URL: https://www.wjgnet.com/1007-9327/full/v24/i10/1167.htm
- DOI: https://dx.doi.org/10.3748/wjg.v24.i10.1167


