Copyright
©The Author(s) 2017.
World J Gastroenterol. Feb 28, 2017; 23(8): 1469-1476
Published online Feb 28, 2017. doi: 10.3748/wjg.v23.i8.1469
Published online Feb 28, 2017. doi: 10.3748/wjg.v23.i8.1469
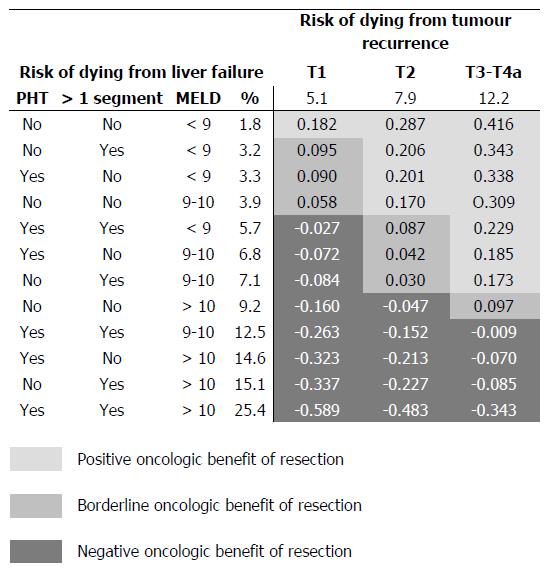
Figure 2 Comparison between the predicted average risk of dying for liver failure (rows) and for tumour recurrence (columns) within the first 5 years after surgery, resulting from the competing-risk regression model.
The average risks reported derive from: (1) the calculation of the area under the curves (AUC) of the risk of dying from liver failure and from tumour recurrence over time, predicted by the competing-risk model of Table 3; and (2) the division of the obtained AUCs by the time-period considered (5 years). Comparison between these two distinct risks is reported as effect size: values < |0.1| indicated very small differences between the means; values between |0.1| and |0.3| indicated small differences, values between |0.3| and |0.5| indicated moderate differences, and values > |0.5| indicated considerable differences. When the risk of dying of liver failure after resection is greater than that of dying from tumour relapse, effect size returns negative values (dark grey cells).
- Citation: Cucchetti A, Sposito C, Pinna AD, Citterio D, Cescon M, Bongini M, Ercolani G, Cotsoglou C, Maroni L, Mazzaferro V. Competing risk analysis on outcome after hepatic resection of hepatocellular carcinoma in cirrhotic patients. World J Gastroenterol 2017; 23(8): 1469-1476
- URL: https://www.wjgnet.com/1007-9327/full/v23/i8/1469.htm
- DOI: https://dx.doi.org/10.3748/wjg.v23.i8.1469


