Copyright
©The Author(s) 2017.
World J Gastroenterol. Nov 14, 2017; 23(42): 7505-7518
Published online Nov 14, 2017. doi: 10.3748/wjg.v23.i42.7505
Published online Nov 14, 2017. doi: 10.3748/wjg.v23.i42.7505
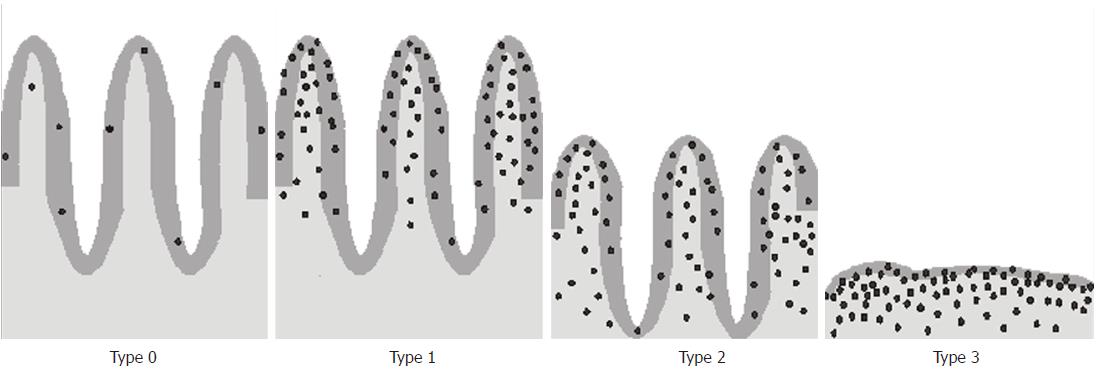
Figure 4 A schematic illustration of progressive histopathological changes in the small intestine according to the modified Marsh-Oberhuber grading scale.
Type 0: Normal mucosa with IEL count < 25 per 100 enterocytes; Type 1: Normal mucosa with an increased IEL count; Types 2 and 3 show increased IEL counts and lymphocytes in the lamina propria. IELs are presented as black dots. IEL: Intraepithelial lymphocyte.
- Citation: Cukrowska B, Sowińska A, Bierła JB, Czarnowska E, Rybak A, Grzybowska-Chlebowczyk U. Intestinal epithelium, intraepithelial lymphocytes and the gut microbiota - Key players in the pathogenesis of celiac disease. World J Gastroenterol 2017; 23(42): 7505-7518
- URL: https://www.wjgnet.com/1007-9327/full/v23/i42/7505.htm
- DOI: https://dx.doi.org/10.3748/wjg.v23.i42.7505


