Copyright
©The Author(s) 2017.
World J Gastroenterol. Nov 7, 2017; 23(41): 7450-7458
Published online Nov 7, 2017. doi: 10.3748/wjg.v23.i41.7450
Published online Nov 7, 2017. doi: 10.3748/wjg.v23.i41.7450
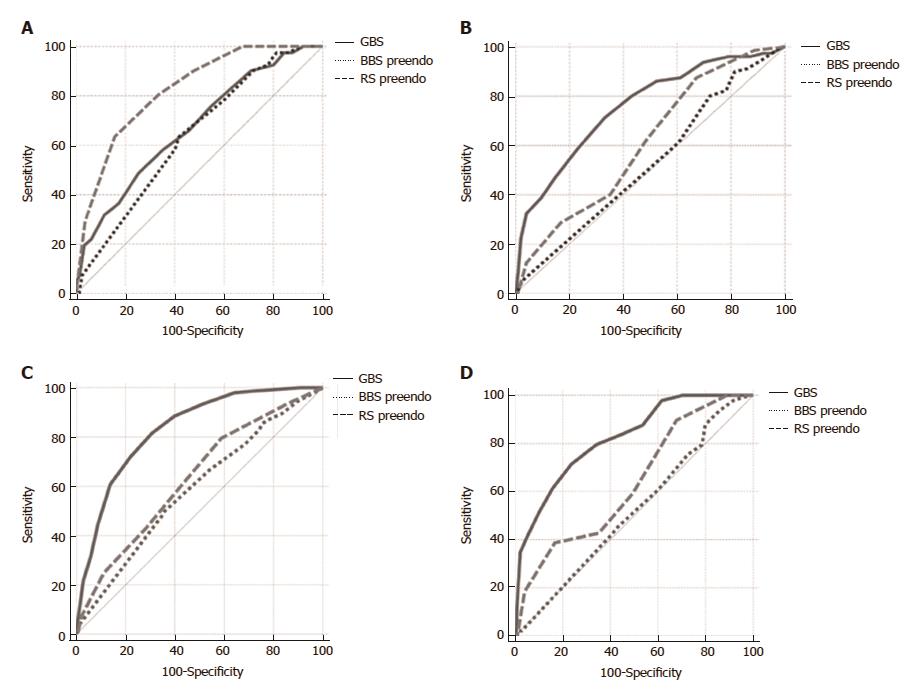
Figure 2 Comparison of the Glasgow-Blatchford score, pre-endoscopic Rockall score and pre-endoscopic Baylor bleeding score for the prediction of death, recurrent bleeding, transfusion or surgical intervention.
A: AUROC [0.67 (95%CI: 0.64-0.70)] vs [0.82 (95%CI: 0.79-0.84)] vs [0.63 (95%CI: 0.60-0.66)]; B: AUROC [0.75 (95%CI: 0.72-0.78)] vs [0.61 (95%CI: 0.57-0.64)] vs [0.52 (95%CI: 0.49- 0.56)]; C: AUROC [0.83 (95%CI: 0.80-0.85)] vs [0.63 (95%CI: 0.59-0.66)] vs [0.58 (95%CI: 0.55-0.62)]; D: AUROC [0.82 (95%CI: 0.79-0.84)] vs [0.63 (95%CI: 0.60-0.66)] vs [0.52 (95%CI: 0.48-0.55)]. GBS: Glasgow-Blatchford score; BBS: Baylor bleeding score; RS: Rockall score.
- Citation: Budimir I, Stojsavljević S, Baršić N, Bišćanin A, Mirošević G, Bohnec S, Kirigin LS, Pavić T, Ljubičić N. Scoring systems for peptic ulcer bleeding: Which one to use? World J Gastroenterol 2017; 23(41): 7450-7458
- URL: https://www.wjgnet.com/1007-9327/full/v23/i41/7450.htm
- DOI: https://dx.doi.org/10.3748/wjg.v23.i41.7450


