Copyright
©The Author(s) 2017.
World J Gastroenterol. Sep 21, 2017; 23(35): 6412-6419
Published online Sep 21, 2017. doi: 10.3748/wjg.v23.i35.6412
Published online Sep 21, 2017. doi: 10.3748/wjg.v23.i35.6412
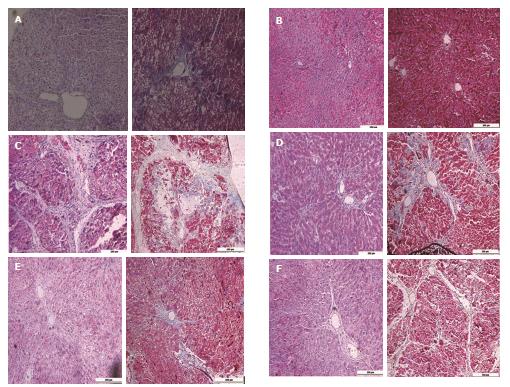
Figure 2 Liver histopathology of rat liver fibrosis/cirrhosis.
A: Liver histopathology in the model group at wk 8; B: Liver histopathology in the healthy control group at wk 12; C: Liver histopathology in the TAA group at wk 12; D: Liver histopathology in the TAA + low-dose aspirin group at wk 12; E: Liver histopathology in the TAA + high-dose aspirin group at wk 12; and F: Liver histopathology in the TAA + enoxaparin group at wk 12. Left: HE × 100; Right: Masson × 100. TAA: Thioacetamide.
- Citation: Li CJ, Yang ZH, Shi XL, Liu DL. Effects of aspirin and enoxaparin in a rat model of liver fibrosis. World J Gastroenterol 2017; 23(35): 6412-6419
- URL: https://www.wjgnet.com/1007-9327/full/v23/i35/6412.htm
- DOI: https://dx.doi.org/10.3748/wjg.v23.i35.6412


