Copyright
©The Author(s) 2017.
World J Gastroenterol. Aug 7, 2017; 23(29): 5345-5355
Published online Aug 7, 2017. doi: 10.3748/wjg.v23.i29.5345
Published online Aug 7, 2017. doi: 10.3748/wjg.v23.i29.5345
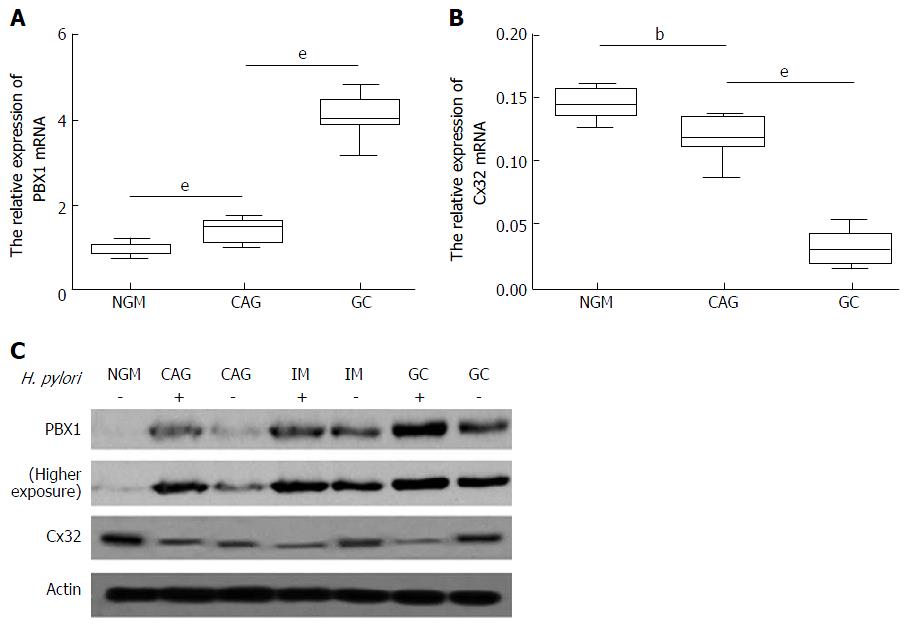
Figure 1 Comparison of PBX1 and connexin 32 expression among developmental stages of Helicobacter pylori-associated gastric carcinoma in clinical specimens.
Quantitative RT-PCR analysis of PBX1 (A) and Cx32 (B) in H. pylori (-) NGM and H. pylori (+) CAG and GC patients (n = 15). C: Representative images of the PBX1 and Cx32 protein levels in H. pylori (-) NGM and H. pylori (-/+) CAG, IM and GC tissues. bP < 0.01, eP < 0.001. NGM: Normal gastric mucosa; CAG: Chronic atrophic gastritis; GC: Gastric cancer; IM: Intestinal metaplasia.
- Citation: Liu XM, Xu CX, Zhang LF, Huang LH, Hu TZ, Li R, Xia XJ, Xu LY, Luo L, Jiang XX, Li M. PBX1 attributes as a determinant of connexin 32 downregulation in Helicobacter pylori-related gastric carcinogenesis. World J Gastroenterol 2017; 23(29): 5345-5355
- URL: https://www.wjgnet.com/1007-9327/full/v23/i29/5345.htm
- DOI: https://dx.doi.org/10.3748/wjg.v23.i29.5345


