Copyright
©The Author(s) 2017.
World J Gastroenterol. Mar 14, 2017; 23(10): 1771-1779
Published online Mar 14, 2017. doi: 10.3748/wjg.v23.i10.1771
Published online Mar 14, 2017. doi: 10.3748/wjg.v23.i10.1771
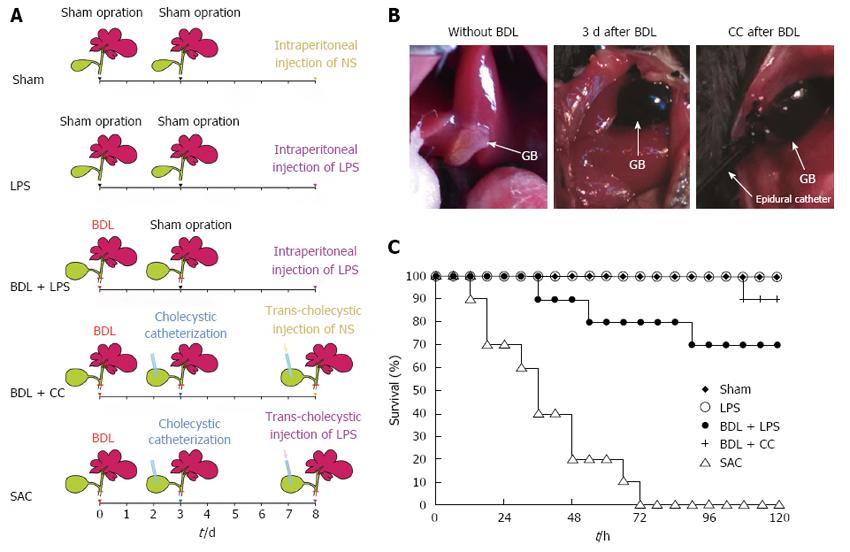
Figure 1 Cholecystostomy.
A: Schematic description of experimental groups; B: Cholecystic catheterization under the condition of bile duct ligation; C: The survival rates of mice in five groups after intraperitoneal injection or trans-cholecystic injection (n = 10). BDL: Bile duct ligation; CC: Cholecystic catheterization; NS: Normal saline.
- Citation: Yu JH, Tang HJ, Zhang WG, Zhu ZY, Ruan XX, Lu BC. Catheterization of the gallbladder: A novel mouse model of severe acute cholangitis. World J Gastroenterol 2017; 23(10): 1771-1779
- URL: https://www.wjgnet.com/1007-9327/full/v23/i10/1771.htm
- DOI: https://dx.doi.org/10.3748/wjg.v23.i10.1771


