Copyright
©The Author(s) 2016.
World J Gastroenterol. Feb 14, 2016; 22(6): 2071-2080
Published online Feb 14, 2016. doi: 10.3748/wjg.v22.i6.2071
Published online Feb 14, 2016. doi: 10.3748/wjg.v22.i6.2071
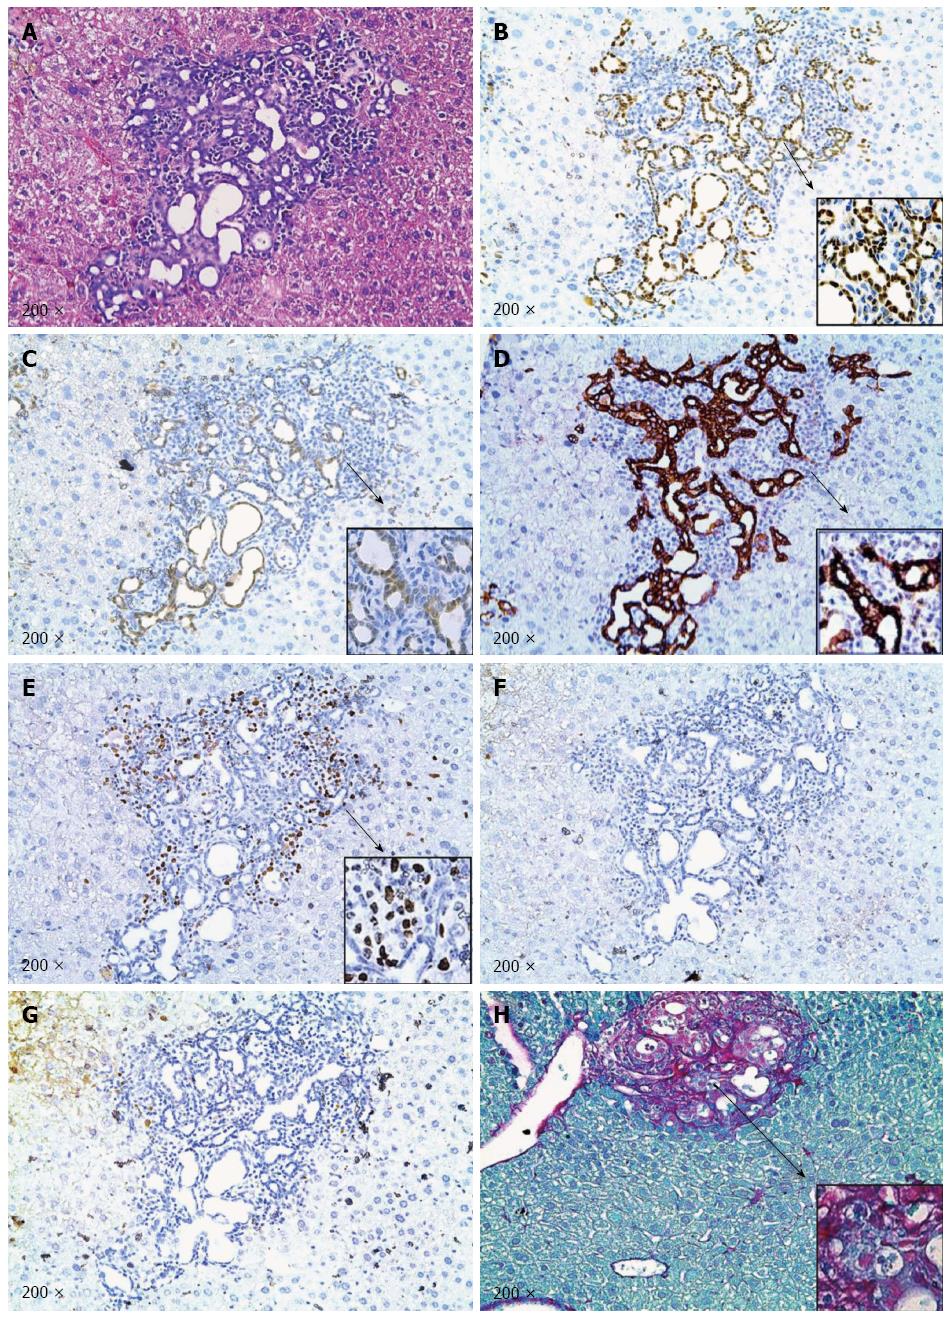
Figure 5 Molecular characterization of NICD/shP53/IDH1R132C induced ICCs.
A: Representative hematoxylin-eosin (HE) stained image of NICD/shP53/IDH1R132C ICC tumors; B: Myc tag; C: Flag tag; D: CK19; E: Ki67; F: p-AKT and G: p-ERK1/2 immunostaining in NICD/shP53/IDH1R132C ICC tumor samples; H: Picro-Sirius red staining image of a liver section showing profound desmoplastic reaction in a NICD/shP53/IDH1R132C ICC tumor sample. Inset: Expanded view of the immunostaining images.
- Citation: Ding N, Che L, Li XL, Liu Y, Jiang LJ, Fan B, Tao JY, Chen X, Ji JF. Oncogenic potential of IDH1R132C mutant in cholangiocarcinoma development in mice. World J Gastroenterol 2016; 22(6): 2071-2080
- URL: https://www.wjgnet.com/1007-9327/full/v22/i6/2071.htm
- DOI: https://dx.doi.org/10.3748/wjg.v22.i6.2071


