Copyright
©The Author(s) 2016.
World J Gastroenterol. Dec 14, 2016; 22(46): 10158-10165
Published online Dec 14, 2016. doi: 10.3748/wjg.v22.i46.10158
Published online Dec 14, 2016. doi: 10.3748/wjg.v22.i46.10158
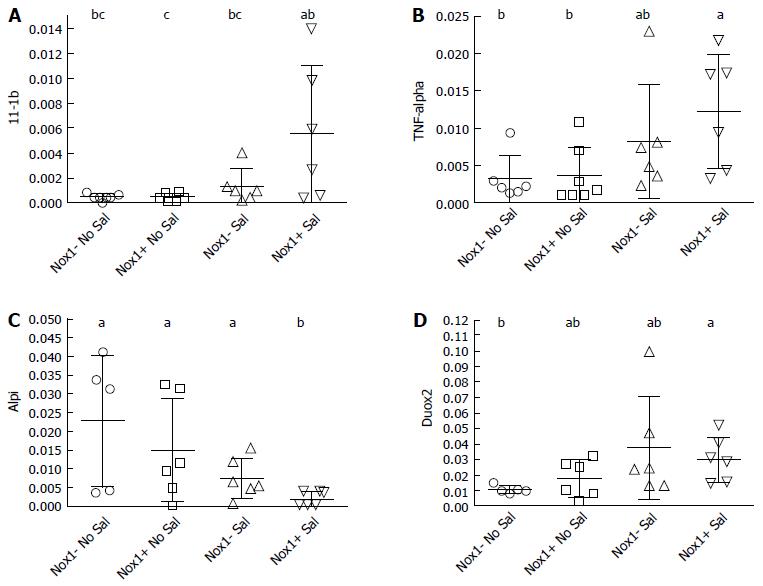
Figure 3 Quantitative real-time polymerase chain reaction analysis of cecum mRNA from the 2 × 10⁶ CFU-treated wild-type and Nox1-knockout mice to measure inflammation markers IL-β (A), TNF-α (B), a brush border marker for the integrity of the epithelium, Alpi (C); and Duox2 levels (D).
Horizontal bars are mean ± SD. The groups with different letter designations in each figure are different, where a > b > c (α = 0.05). The groups sharing a same letter are not different; e.g., bc is not different from b or ab group. Nox1-KO: Nox1-knockout; WT: Wild-type.
- Citation: Chu FF, Esworthy RS, Doroshow JH, Shen B. NADPH oxidase-1 deficiency offers little protection in Salmonella typhimurium-induced typhlitis in mice. World J Gastroenterol 2016; 22(46): 10158-10165
- URL: https://www.wjgnet.com/1007-9327/full/v22/i46/10158.htm
- DOI: https://dx.doi.org/10.3748/wjg.v22.i46.10158


