Copyright
©The Author(s) 2016.
World J Gastroenterol. Nov 21, 2016; 22(43): 9654-9660
Published online Nov 21, 2016. doi: 10.3748/wjg.v22.i43.9654
Published online Nov 21, 2016. doi: 10.3748/wjg.v22.i43.9654
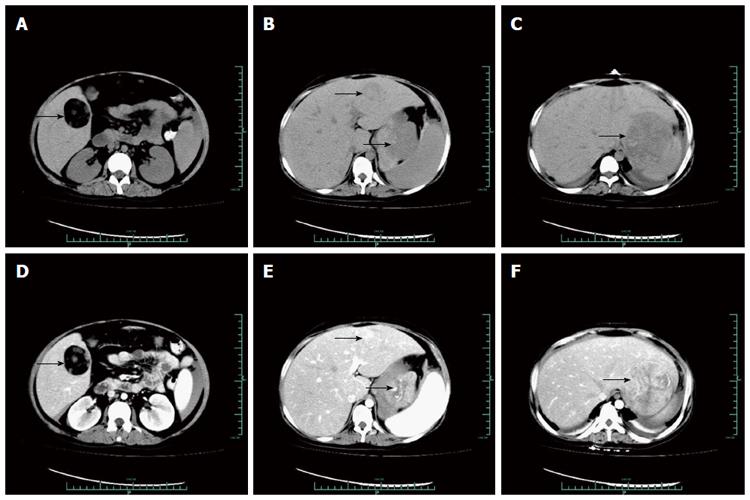
Figure 1 Computed tomography findings.
A: An unenhanced computed tomography (CT) image showing a well-defined low-density mass (arrow) with adipose components in the right liver lobe, 4.2 cm × 4.1 cm in size; B and C: Two inhomogeneous low-density masses (arrows) are shown in the left liver lobe, 8.6 cm × 7.7 cm and 2.6 cm × 2.6 cm in size, respectively; D, E and F: In the contrast-enhanced CT image, the masses in both the right and left liver lobes are heterogeneously enhanced.
- Citation: Xu SY, Xie HY, Zhou L, Zheng SS, Wang WL. Synchronous occurrence of a hepatic myelolipoma and two hepatocellular carcinomas. World J Gastroenterol 2016; 22(43): 9654-9660
- URL: https://www.wjgnet.com/1007-9327/full/v22/i43/9654.htm
- DOI: https://dx.doi.org/10.3748/wjg.v22.i43.9654


