Copyright
©The Author(s) 2016.
World J Gastroenterol. Oct 21, 2016; 22(39): 8684-8697
Published online Oct 21, 2016. doi: 10.3748/wjg.v22.i39.8684
Published online Oct 21, 2016. doi: 10.3748/wjg.v22.i39.8684
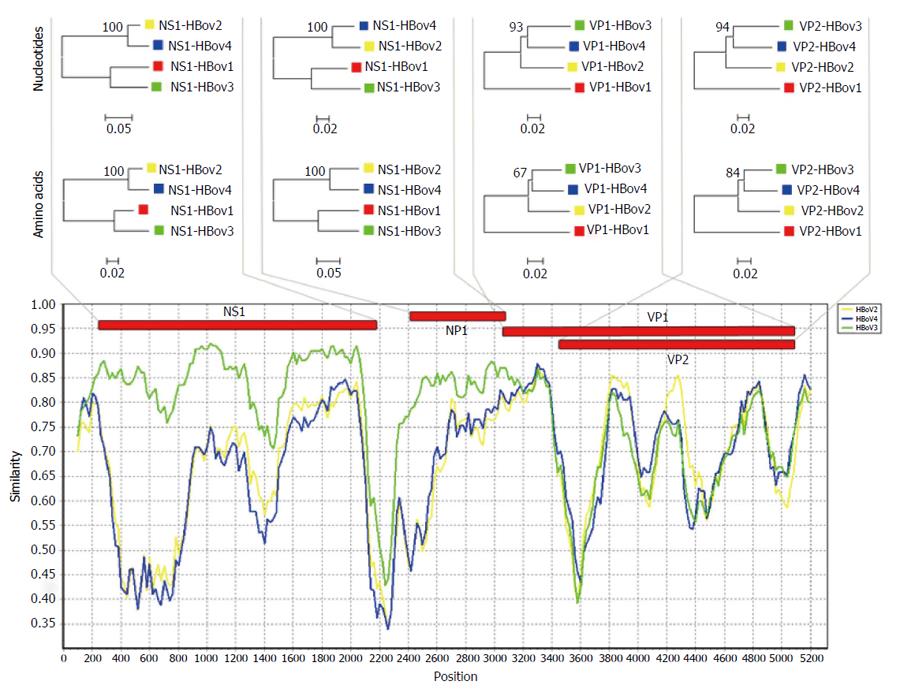
Figure 2 Similarity plot (generated by SimPlot)[56] of Human Bocaviruses genomes.
Each curve is a comparison between the HBoV1 genome (reference) and HBoV2-4 sequences. Nucleotide sequences were aligned using Clustal Omega[57] and the plot was rendered by Simplot using a window size of 200 bp and a step size of 20 bp. The horizontal bars above the curves represent the HBoV1 genes arranged as indicated in Figure 1; Phylogenetic trees of nucleotide and amino acid sequences of the HBoV genes. Sequences were aligned by Clustal Omega and phylogenetic analysis was carried out using the Neighbor-Joining method implemented in the MEGA5 program[58]. The numbers at the branch nodes indicate the bootstrap values calculated with 1000 replicates.
- Citation: Guido M, Tumolo MR, Verri T, Romano A, Serio F, De Giorgi M, De Donno A, Bagordo F, Zizza A. Human bocavirus: Current knowledge and future challenges. World J Gastroenterol 2016; 22(39): 8684-8697
- URL: https://www.wjgnet.com/1007-9327/full/v22/i39/8684.htm
- DOI: https://dx.doi.org/10.3748/wjg.v22.i39.8684


