Copyright
©The Author(s) 2016.
World J Gastroenterol. Aug 28, 2016; 22(32): 7353-7364
Published online Aug 28, 2016. doi: 10.3748/wjg.v22.i32.7353
Published online Aug 28, 2016. doi: 10.3748/wjg.v22.i32.7353
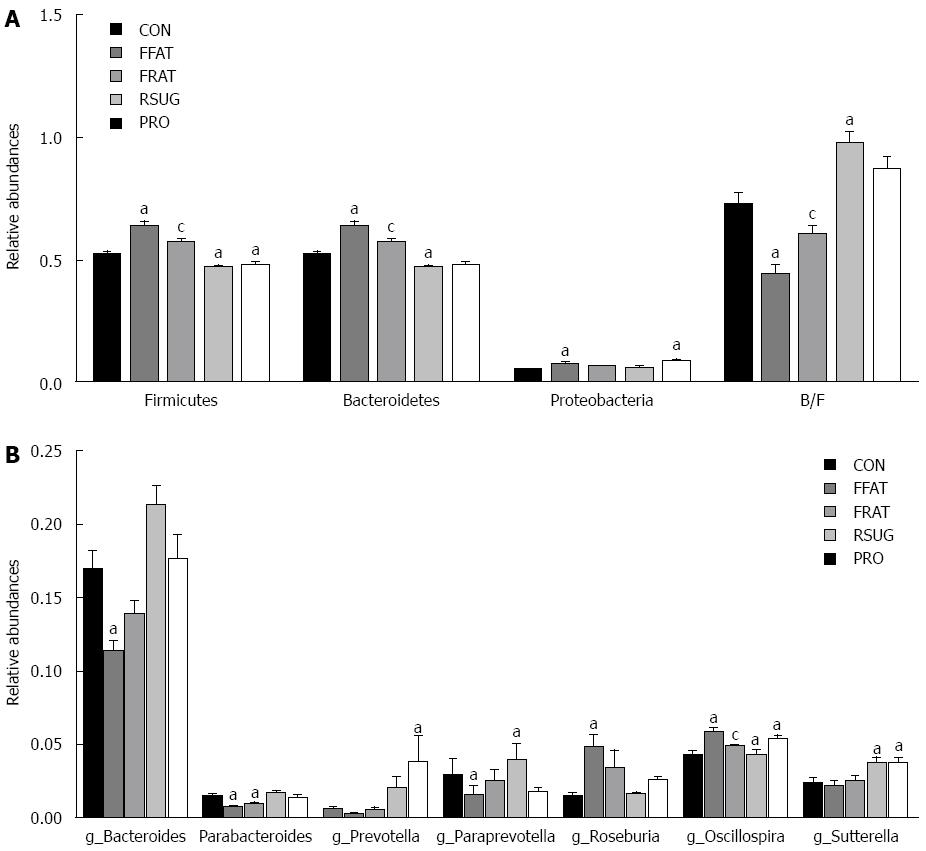
Figure 6 Comparison of relative abundance at the phylum and genus levels.
A: Comparison of relative abundance at the phylum level; B: Comparison of relative abundance at the genus level. aP < 0.05 vs CON group rats; cP < 0.05, FFAT group rats vs RFAT group rats. B/F: Ratio of Bacteroidetes to Firmicutes; FFAT: Free high-fat diet; RSUG: Restrictive high-sugar diet; RFAT: Restrictive high-fat diet; CON: Control diet.
- Citation: Liu JP, Zou WL, Chen SJ, Wei HY, Yin YN, Zou YY, Lu FG. Effects of different diets on intestinal microbiota and nonalcoholic fatty liver disease development. World J Gastroenterol 2016; 22(32): 7353-7364
- URL: https://www.wjgnet.com/1007-9327/full/v22/i32/7353.htm
- DOI: https://dx.doi.org/10.3748/wjg.v22.i32.7353


