Copyright
©The Author(s) 2016.
World J Gastroenterol. Aug 28, 2016; 22(32): 7353-7364
Published online Aug 28, 2016. doi: 10.3748/wjg.v22.i32.7353
Published online Aug 28, 2016. doi: 10.3748/wjg.v22.i32.7353
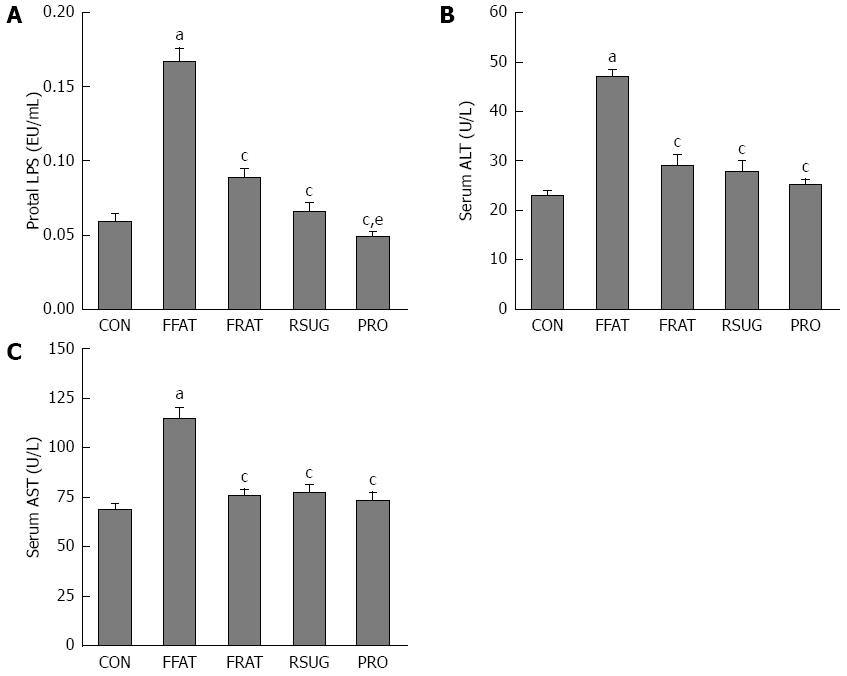
Figure 3 Portal lipopolysaccharide and liver function in rats.
A: Portal LPS; B: Serum ALT; C: Serum AST. Values are expressed as mean ± SE. Differences were denoted as follows: aP < 0.05 vs CON group rats, cP < 0.05 vs FFAT group rats, eP < 0.05 vs RFAT group rats. LPS: Lipopolysaccharide; ALT: Alanine aminotransferase; AST: Aspartate aminotransferase.
- Citation: Liu JP, Zou WL, Chen SJ, Wei HY, Yin YN, Zou YY, Lu FG. Effects of different diets on intestinal microbiota and nonalcoholic fatty liver disease development. World J Gastroenterol 2016; 22(32): 7353-7364
- URL: https://www.wjgnet.com/1007-9327/full/v22/i32/7353.htm
- DOI: https://dx.doi.org/10.3748/wjg.v22.i32.7353


