Copyright
©The Author(s) 2016.
World J Gastroenterol. Jun 7, 2016; 22(21): 5012-5022
Published online Jun 7, 2016. doi: 10.3748/wjg.v22.i21.5012
Published online Jun 7, 2016. doi: 10.3748/wjg.v22.i21.5012
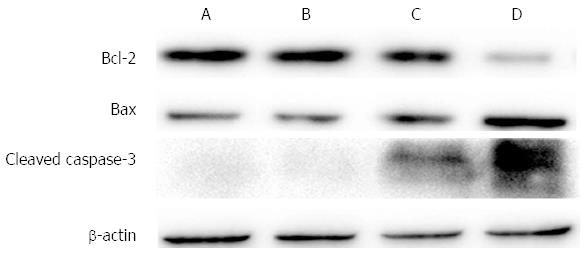
Figure 8 Changes in protein expression levels of Bax, Bcl-2 and caspase-3 following CdSe/ZnS quantum dots with illumination.
A: Normal SW1990 cells; B: SW1990 cells with illumination (20 J/cm2); C: SW1990 cells treated with CdSe/ZnS QDs (1.5 μmol/L, 3 h); D: SW1990 cells treated with CdSe/ZnS QDs (1.5 μmol/L, 3 h) and illumination (20J/cm2). QDs: Quantum dots.
- Citation: He SJ, Cao J, Li YS, Yang JC, Zhou M, Qu CY, Zhang Y, Shen F, Chen Y, Li MM, Xu LM. CdSe/ZnS quantum dots induce photodynamic effects and cytotoxicity in pancreatic cancer cells. World J Gastroenterol 2016; 22(21): 5012-5022
- URL: https://www.wjgnet.com/1007-9327/full/v22/i21/5012.htm
- DOI: https://dx.doi.org/10.3748/wjg.v22.i21.5012


