Copyright
©The Author(s) 2016.
World J Gastroenterol. Jan 7, 2016; 22(1): 72-88
Published online Jan 7, 2016. doi: 10.3748/wjg.v22.i1.72
Published online Jan 7, 2016. doi: 10.3748/wjg.v22.i1.72
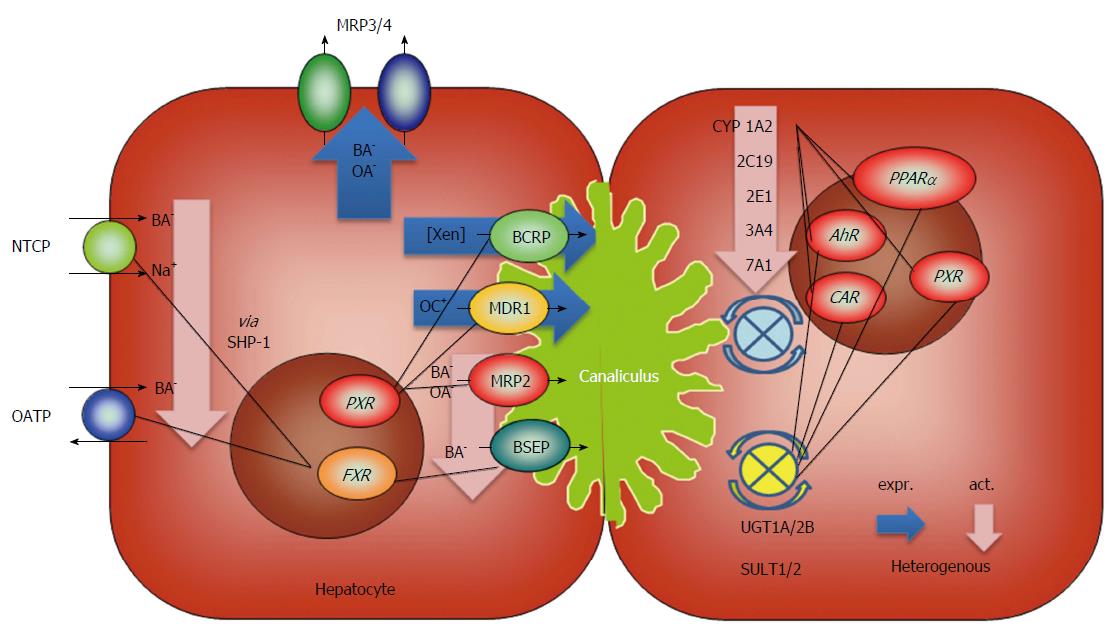
Figure 2 Regulatory events in hepatocytes in liver cirrhosis.
In the left hepatocyte, the regulation in transport proteins (phase 0 and phase III) is shown, and in the right hepatocyte, regulation in phase I and phase II metabolism is summarized. Large arrows show the tendency of protein expression and/or activity for the respective single enzyme/transporter or groups of enzymes/transporters (up- or downregulation or no change). Central nuclear receptors for each group of enzymes are additionally shown. Details and source of the data are given in the text. expr.: Expression; act.: Activity; BA: Bile acids; OA: Organic anions; OC: Organic cations; Xen: Xenobiotics; NTCP: Na-taurocholate co-transporting polypeptide; OATP: Organic anion-transporting polypeptide; UGT: Uridine-diphosphate-glucuronosyltransferase; SULT: Sulfotransferase; MRP: Multidrug resistance-associated protein.
- Citation: Dietrich CG, Götze O, Geier A. Molecular changes in hepatic metabolism and transport in cirrhosis and their functional importance. World J Gastroenterol 2016; 22(1): 72-88
- URL: https://www.wjgnet.com/1007-9327/full/v22/i1/72.htm
- DOI: https://dx.doi.org/10.3748/wjg.v22.i1.72


