Copyright
©The Author(s) 2015.
World J Gastroenterol. Dec 7, 2015; 21(45): 12787-12799
Published online Dec 7, 2015. doi: 10.3748/wjg.v21.i45.12787
Published online Dec 7, 2015. doi: 10.3748/wjg.v21.i45.12787
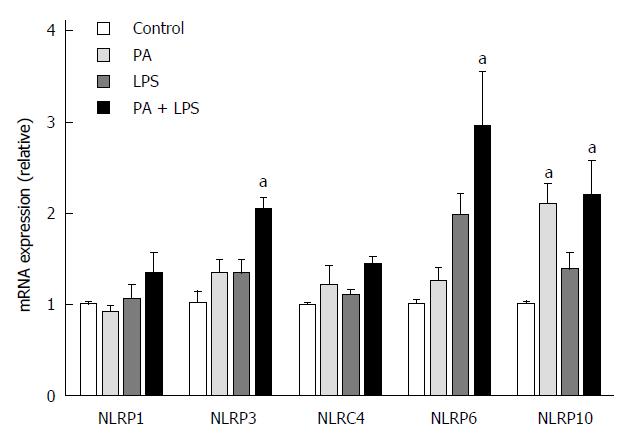
Figure 3 Expression of inflammasome components in HepG2 cells after stimulation with palmitic acid and lipopolysaccharide.
Relative mRNA levels of NLRP1, NLRP3, NLRC4, NLRP6, and NLRP10 in HepG2 cells were analyzed by RT-PCR. Compared with the control group, significantly increased expression of NLPR3, NLRP6, and NLRP10 was observed in the PA and LPS stimulation group. Data are expressed as the mean ± SD. aP < 0.05 vs control cells.
- Citation: Lee HJ, Yeon JE, Ko EJ, Yoon EL, Suh SJ, Kang K, Kim HR, Kang SH, Yoo YJ, Je J, Lee BJ, Kim JH, Seo YS, Yim HJ, Byun KS. Peroxisome proliferator-activated receptor-delta agonist ameliorated inflammasome activation in nonalcoholic fatty liver disease. World J Gastroenterol 2015; 21(45): 12787-12799
- URL: https://www.wjgnet.com/1007-9327/full/v21/i45/12787.htm
- DOI: https://dx.doi.org/10.3748/wjg.v21.i45.12787


