Copyright
©The Author(s) 2015.
World J Gastroenterol. Nov 21, 2015; 21(43): 12498-12504
Published online Nov 21, 2015. doi: 10.3748/wjg.v21.i43.12498
Published online Nov 21, 2015. doi: 10.3748/wjg.v21.i43.12498
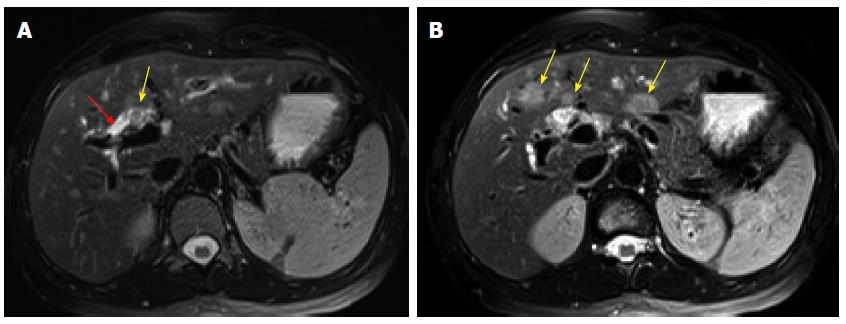
Figure 1 Non-enhanced magnetic resonance imaging.
A: Axial T2 with fat saturation (96/3000) demonstrates dilatation of the proximal right hepatic duct (red arrow) with soft tissue noted within the lumen (yellow arrow); B: Axial T2 with fat saturation (96/3000) demonstrates three ill defined, rounded hyperintense lesions in segments III and IVB (arrows).
- Citation: Tan Y, Milikowski C, Toribio Y, Singer A, Rojas CP, Garcia-Buitrago MT. Intraductal papillary neoplasm of the bile ducts: A case report and literature review. World J Gastroenterol 2015; 21(43): 12498-12504
- URL: https://www.wjgnet.com/1007-9327/full/v21/i43/12498.htm
- DOI: https://dx.doi.org/10.3748/wjg.v21.i43.12498


