Copyright
©The Author(s) 2015.
World J Gastroenterol. Nov 7, 2015; 21(41): 11597-11608
Published online Nov 7, 2015. doi: 10.3748/wjg.v21.i41.11597
Published online Nov 7, 2015. doi: 10.3748/wjg.v21.i41.11597
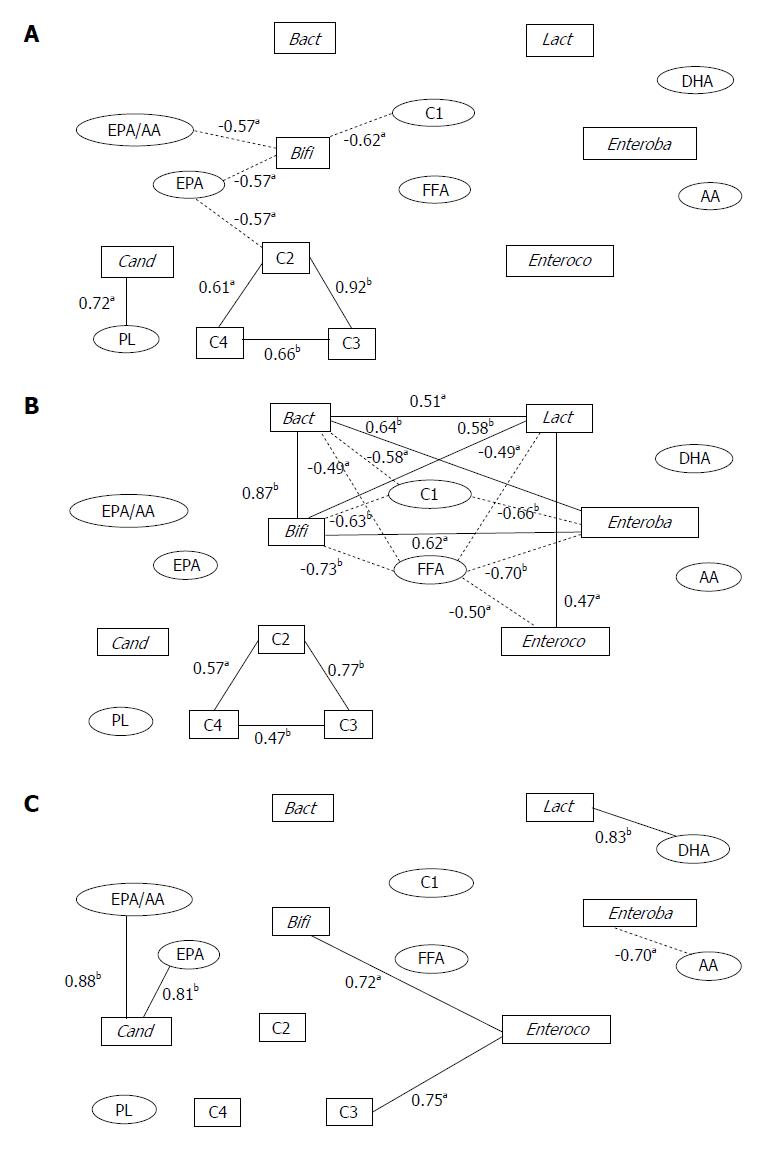
Figure 1 Correlation networks among fecal microflora and organic acid and serum organic and fatty acid concentrations in hepatic cancer patients.
Square boxes indicate fecal components and ellipsoids indicate serum components. Solid lines indicate positive correlations and dotted lines indicate negative correlations. A: Normal liver group; B: Chronic hepatitis or liver fibrosis group; C: Liver cirrhosis group. aP < 0.05 and bP < 0.01 by Pearson’s correlation coefficient test. Bact: Bacteroidaceae; Bifi: Bifidobacterium; Lact: Lactobacillus; Enteroba: Enterobacteriaceae; Enteroco: Enterococcus; Cand: Candida; C1: Formic acid; C2: Acetic acid; C3: Propionic acid; C4: Butyric acid; AA: Arachidonic acid; EPA: Eicosapentaenoic acid; DHA: Docosahexaenoic acid; FFA: Free fatty acid; PL: Phospholipid. Data adapted from Usami et al[46].
- Citation: Usami M, Miyoshi M, Yamashita H. Gut microbiota and host metabolism in liver cirrhosis. World J Gastroenterol 2015; 21(41): 11597-11608
- URL: https://www.wjgnet.com/1007-9327/full/v21/i41/11597.htm
- DOI: https://dx.doi.org/10.3748/wjg.v21.i41.11597


