Copyright
©The Author(s) 2015.
World J Gastroenterol. Jan 21, 2015; 21(3): 854-861
Published online Jan 21, 2015. doi: 10.3748/wjg.v21.i3.854
Published online Jan 21, 2015. doi: 10.3748/wjg.v21.i3.854
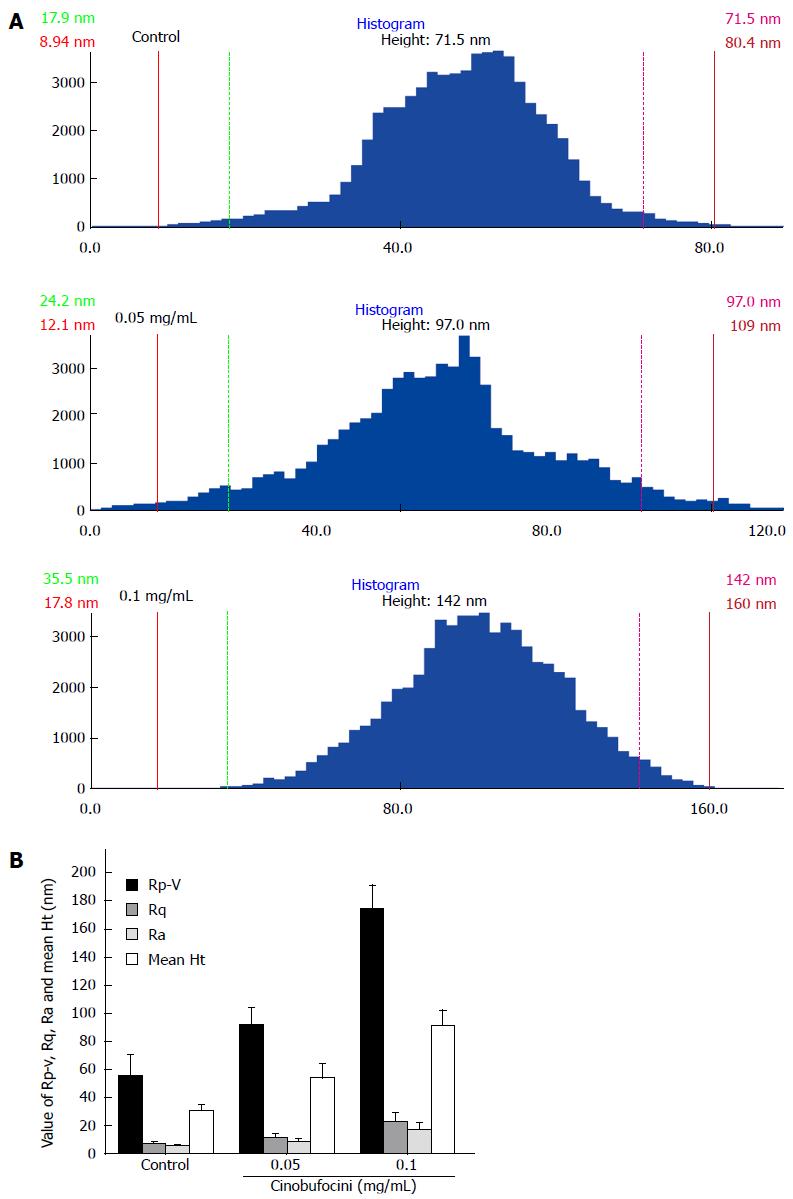
Figure 5 Average size of surface particles on control HepG2 cells.
A: Histograms of cell membrane particle size distributions of ultrastructure in Figure 4; B: Statistical analysis of the membrane Rp-v, Rq, Ra and mean Ht of HepG2 cell surface; these values increased as cinobufacini concentration increased (P = 0.000). The data showed that cinobufacini treatment induced rougher cell membranes.
- Citation: Wu Q, Lin WD, Liao GQ, Zhang LG, Wen SQ, Lin JY. Antiproliferative effects of cinobufacini on human hepatocellular carcinoma HepG2 cells detected by atomic force microscopy. World J Gastroenterol 2015; 21(3): 854-861
- URL: https://www.wjgnet.com/1007-9327/full/v21/i3/854.htm
- DOI: https://dx.doi.org/10.3748/wjg.v21.i3.854


