Copyright
©The Author(s) 2015.
World J Gastroenterol. Jul 7, 2015; 21(25): 7851-7859
Published online Jul 7, 2015. doi: 10.3748/wjg.v21.i25.7851
Published online Jul 7, 2015. doi: 10.3748/wjg.v21.i25.7851
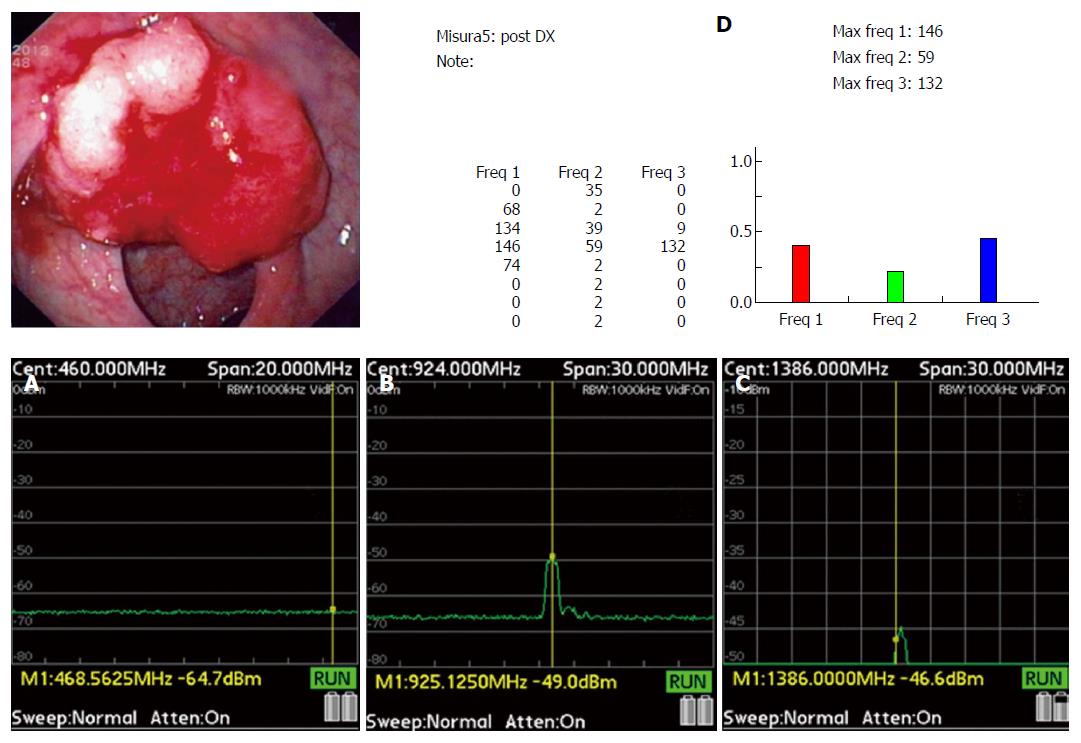
Figure 3 Colon cancer as observed by colonoscopy and by the TRIMprob.
Spectral lines A, B and C correspond to the red, green and blue bars respectively in D. The interaction between the electromagnetic field emitted by the probe and cancerous tissue results in a significant decrease of 40 dBm at 465 MHz (first spectral line), a modest attenuation at 930 MHz (second spectral line); and at 1395 MHz (third spectral line).
- Citation: Dore MP, Tufano MO, Pes GM, Cuccu M, Farina V, Manca A, Graham DY. Tissue resonance interaction accurately detects colon lesions: A double-blind pilot study. World J Gastroenterol 2015; 21(25): 7851-7859
- URL: https://www.wjgnet.com/1007-9327/full/v21/i25/7851.htm
- DOI: https://dx.doi.org/10.3748/wjg.v21.i25.7851


