Copyright
©The Author(s) 2015.
World J Gastroenterol. Jun 21, 2015; 21(23): 7208-7217
Published online Jun 21, 2015. doi: 10.3748/wjg.v21.i23.7208
Published online Jun 21, 2015. doi: 10.3748/wjg.v21.i23.7208
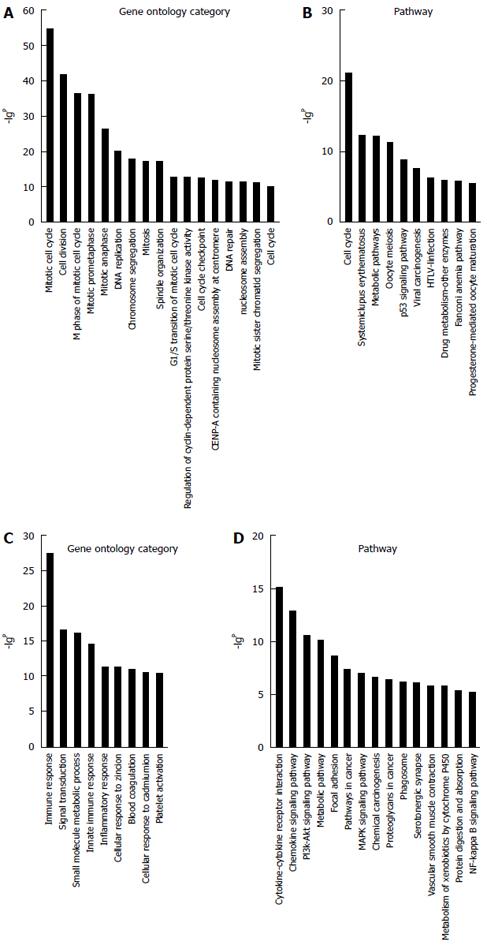
Figure 4 Gene ontology and pathway analyses.
A total of 1270 differentially expressed mRNAs were chosen with a fold change > 3; the column graphs represent the enrichment of these mRNAs. The (-lgP) value is a positive correlation with gene ontology (GO) (A); Signaling pathway enrichment for upregulated mRNAs (B); GO (C); Signaling pathway enrichment for downregulated mRNAs (D). The (-lgP) values above five are presented.
- Citation: Yu TT, Xu XM, Hu Y, Deng JJ, Ge W, Han NN, Zhang MX. Long noncoding RNAs in hepatitis B virus-related hepatocellular carcinoma. World J Gastroenterol 2015; 21(23): 7208-7217
- URL: https://www.wjgnet.com/1007-9327/full/v21/i23/7208.htm
- DOI: https://dx.doi.org/10.3748/wjg.v21.i23.7208


