Copyright
©The Author(s) 2015.
World J Gastroenterol. Jun 21, 2015; 21(23): 7208-7217
Published online Jun 21, 2015. doi: 10.3748/wjg.v21.i23.7208
Published online Jun 21, 2015. doi: 10.3748/wjg.v21.i23.7208
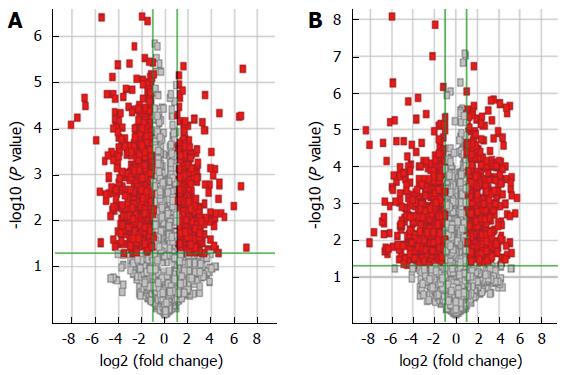
Figure 1 Long noncoding RNAs and mRNA profile comparisons between the hepatocellular carcinoma and adjacent non-tumor tissues.
Volcano plots used to distinguish the different expressed A: Long noncoding RNAs; and B: mRNAs. The vertical green lines correspond to 2.0-fold up- and downregulation, respectively, and the horizontal green lines represent P = 0.05. The red points represent the differentially expressed genes.
- Citation: Yu TT, Xu XM, Hu Y, Deng JJ, Ge W, Han NN, Zhang MX. Long noncoding RNAs in hepatitis B virus-related hepatocellular carcinoma. World J Gastroenterol 2015; 21(23): 7208-7217
- URL: https://www.wjgnet.com/1007-9327/full/v21/i23/7208.htm
- DOI: https://dx.doi.org/10.3748/wjg.v21.i23.7208


