Copyright
©The Author(s) 2015.
World J Gastroenterol. Jan 14, 2015; 21(2): 549-555
Published online Jan 14, 2015. doi: 10.3748/wjg.v21.i2.549
Published online Jan 14, 2015. doi: 10.3748/wjg.v21.i2.549
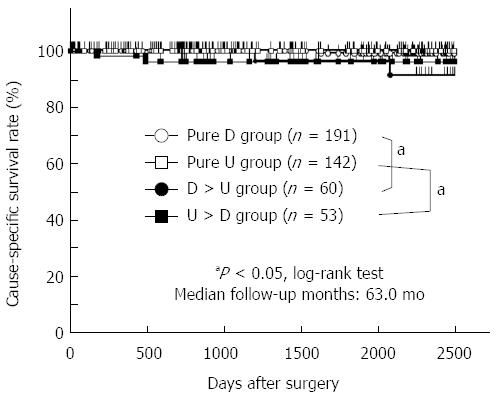
Figure 2 Comparison of cause-specific survival rates of patients in each of the histological subgroups.
Four hundred and forty-six patients were divided into four histological subgroups, pure D, pure U, D > U, and U > D groups. Five-year cause-specific survival rates of the patients in each group were analyzed with the Kaplan-Meier method and log rank test. P < 0.05 was considered statistically significant. aP < 0.05 vs control; D: Differentiated; U: Undifferentiated.
- Citation: Komatsu S, Ichikawa D, Miyamae M, Shimizu H, Konishi H, Shiozaki A, Fujiwara H, Okamoto K, Kishimoto M, Otsuji E. Histological mixed-type as an independent prognostic factor in stage I gastric carcinoma. World J Gastroenterol 2015; 21(2): 549-555
- URL: https://www.wjgnet.com/1007-9327/full/v21/i2/549.htm
- DOI: https://dx.doi.org/10.3748/wjg.v21.i2.549


