Copyright
©The Author(s) 2015.
World J Gastroenterol. Jan 14, 2015; 21(2): 484-490
Published online Jan 14, 2015. doi: 10.3748/wjg.v21.i2.484
Published online Jan 14, 2015. doi: 10.3748/wjg.v21.i2.484
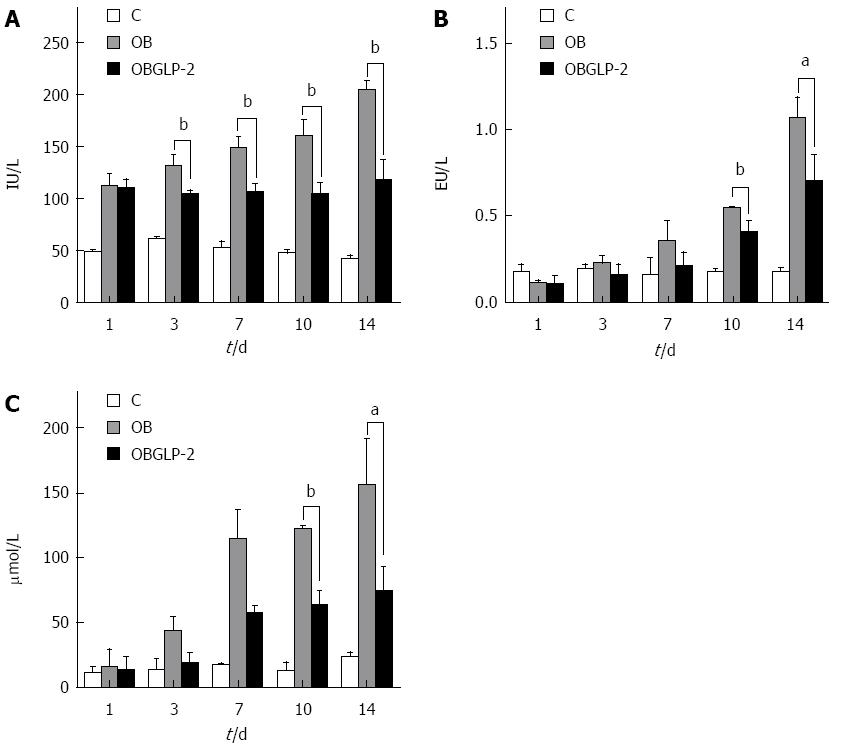
Figure 3 Comparison of serum alanine aminotransferase (A), total bilirubin (B) and endotoxin levels (C) in three groups (n = 12).
aP < 0.05, bP < 0.01, OB vs OBGLP-2. C: Control; OB: Obstructive jaundice; OBGLP-2: Obstructive jaundice with GLP-2.
- Citation: Chen J, Dong JT, Li XJ, Gu Y, Cheng ZJ, Cai YK. Glucagon-like peptide-2 protects impaired intestinal mucosal barriers in obstructive jaundice rats. World J Gastroenterol 2015; 21(2): 484-490
- URL: https://www.wjgnet.com/1007-9327/full/v21/i2/484.htm
- DOI: https://dx.doi.org/10.3748/wjg.v21.i2.484


