Copyright
©The Author(s) 2015.
World J Gastroenterol. Mar 28, 2015; 21(12): 3741-3745
Published online Mar 28, 2015. doi: 10.3748/wjg.v21.i12.3741
Published online Mar 28, 2015. doi: 10.3748/wjg.v21.i12.3741
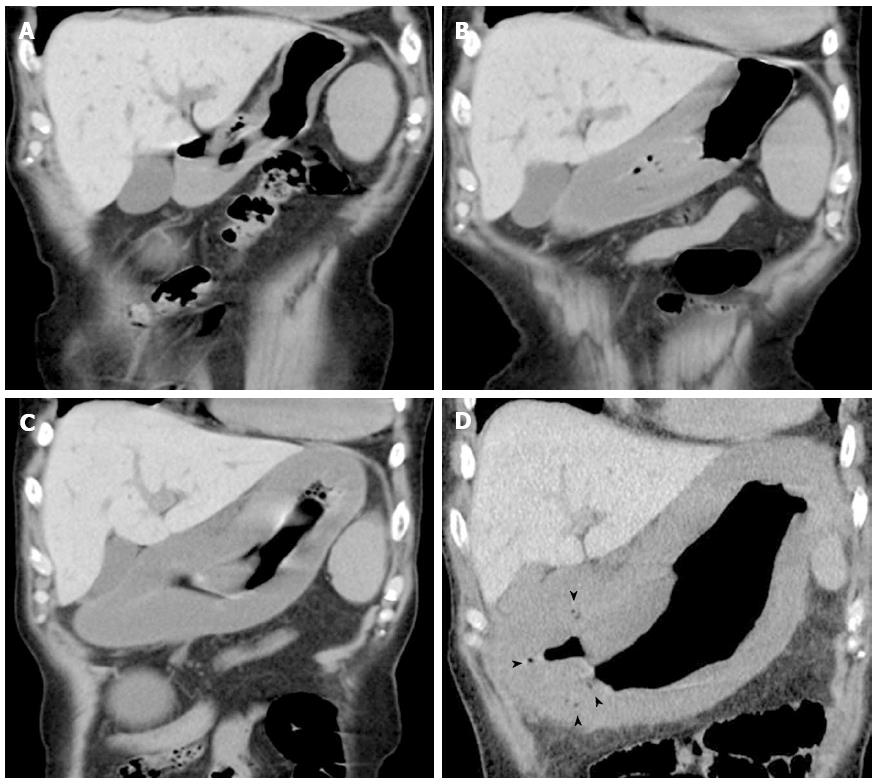
Figure 1 Abdominal computed tomography images show rapid progression of gastric wall hypertrophy.
Twenty days before onset (A) and at 4 h (B), 6 h (C), and 10 h (D) after onset. Arrowheads in (D) indicate intramural gas.
-
Citation: Matsumoto H, Ogura H, Seki M, Ohnishi M, Shimazu T. Fulminant phlegmonitis of the esophagus, stomach, and duodenum due to
Bacillus thuringiensis . World J Gastroenterol 2015; 21(12): 3741-3745 - URL: https://www.wjgnet.com/1007-9327/full/v21/i12/3741.htm
- DOI: https://dx.doi.org/10.3748/wjg.v21.i12.3741


