Copyright
©2014 Baishideng Publishing Group Inc.
World J Gastroenterol. Oct 28, 2014; 20(40): 14841-14854
Published online Oct 28, 2014. doi: 10.3748/wjg.v20.i40.14841
Published online Oct 28, 2014. doi: 10.3748/wjg.v20.i40.14841
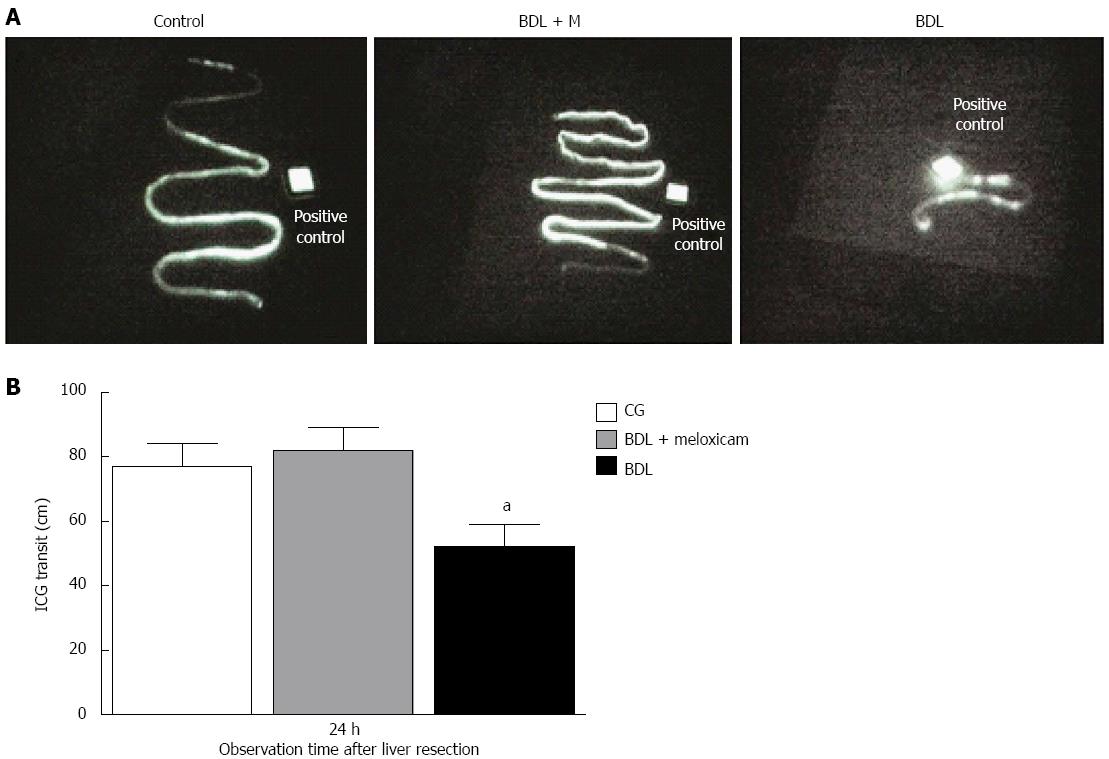
Figure 2 Indocyanine green transit evaluation into the gastrointestinal tract with IC-View System in a 24 h observation time of three groups: Control group; bile duct ligation + meloxicam; and bile duct ligation.
A: Images of ICG transit in small bowel viewed by IC-View System; B: Histogram of the quantified gastrointestinal transit. Values are given as means ± SE. One-way ANOVA. Tukey's Multiple Comparison Test: aP < 0.05 vs BDL + M (n = 5). CG: Control group; BDL: Bile duct ligation; BDL + M: BDL + meloxicam; ICG: Indocyanine green.
- Citation: Hamza AR, Krasniqi AS, Srinivasan PK, Afify M, Bleilevens C, Klinge U, Tolba RH. Gut-liver axis improves with meloxicam treatment after cirrhotic liver resection. World J Gastroenterol 2014; 20(40): 14841-14854
- URL: https://www.wjgnet.com/1007-9327/full/v20/i40/14841.htm
- DOI: https://dx.doi.org/10.3748/wjg.v20.i40.14841


