Copyright
©2014 Baishideng Publishing Group Inc.
World J Gastroenterol. Oct 14, 2014; 20(38): 13911-13919
Published online Oct 14, 2014. doi: 10.3748/wjg.v20.i38.13911
Published online Oct 14, 2014. doi: 10.3748/wjg.v20.i38.13911
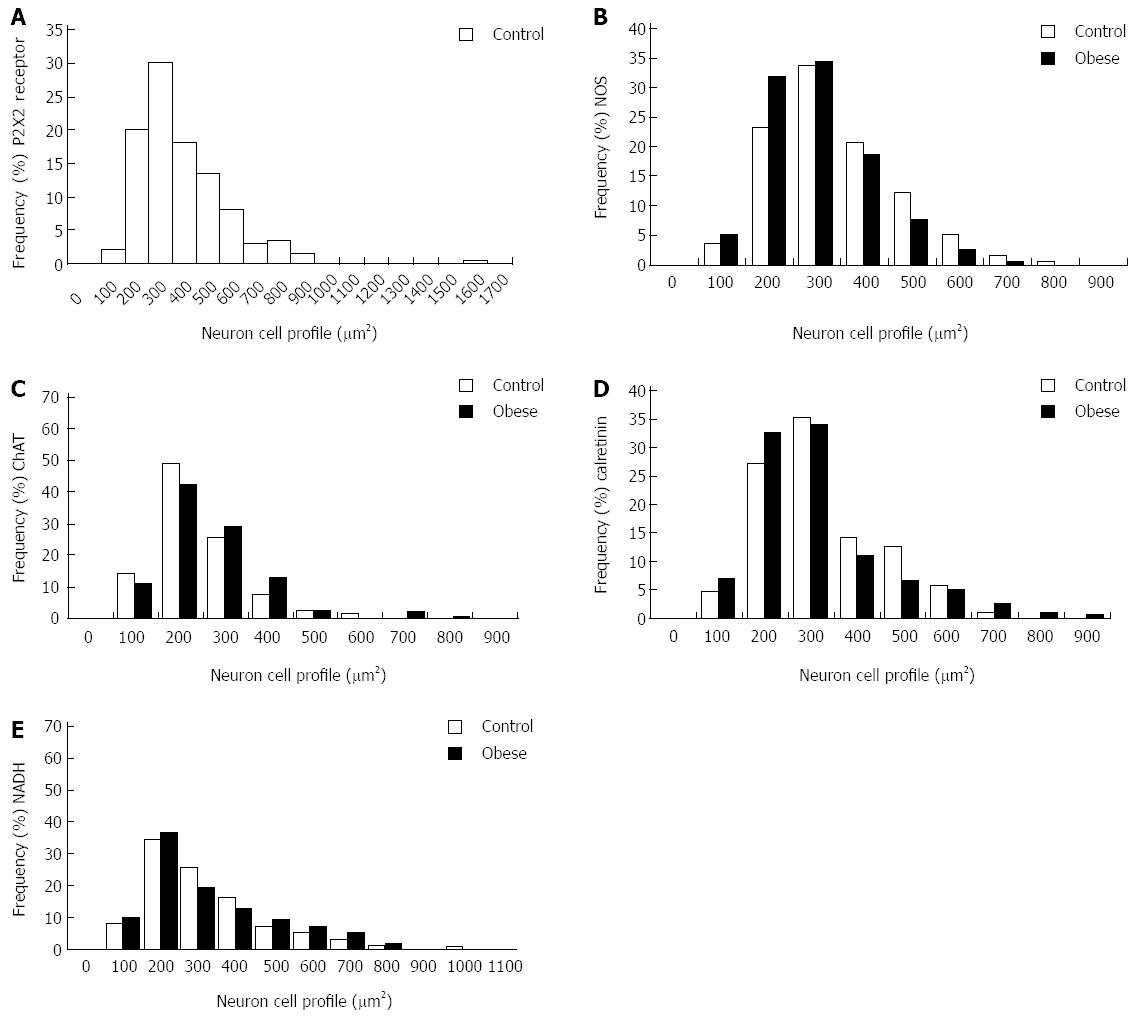
Figure 6 Size distributions of myenteric neurons of the control group and obese group.
Frequency distributions of neuronal size profiles (μm2) for neurons immunoreactive for the P2X2 receptor (A), nitric oxide synthase (NOS) (B), choline acetyltransferase (ChAT) (C), and calretinin (D) and positive for nicotinamide adenine dinucleotide-diaphorase (NADH) (E) activity in the ileum myenteric plexus of control (white bars) and obese (black bars) male mice are shown.
-
Citation: Mizuno MS, Crisma AR, Borelli P, Schäfer BT, Silveira MP, Castelucci P. Distribution of the P2X2 receptor and chemical coding in ileal enteric neurons of obese male mice (
ob/ob ). World J Gastroenterol 2014; 20(38): 13911-13919 - URL: https://www.wjgnet.com/1007-9327/full/v20/i38/13911.htm
- DOI: https://dx.doi.org/10.3748/wjg.v20.i38.13911


