Copyright
©2014 Baishideng Publishing Group Inc.
World J Gastroenterol. Oct 14, 2014; 20(38): 13911-13919
Published online Oct 14, 2014. doi: 10.3748/wjg.v20.i38.13911
Published online Oct 14, 2014. doi: 10.3748/wjg.v20.i38.13911
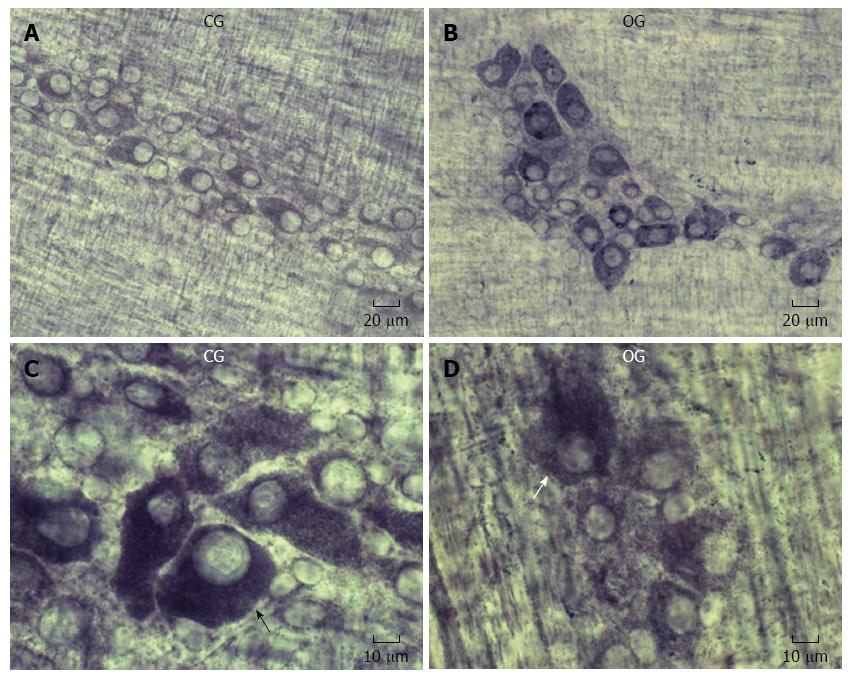
Figure 3 Ileal myenteric neurons labeled for nicotinamide adenine dinucleotide-diaphorase activity in the control group (A, B) and the obese group (C, D).
Arrows show stained myenteric neurons. CG: Control group; OG: Obese group.
-
Citation: Mizuno MS, Crisma AR, Borelli P, Schäfer BT, Silveira MP, Castelucci P. Distribution of the P2X2 receptor and chemical coding in ileal enteric neurons of obese male mice (
ob/ob ). World J Gastroenterol 2014; 20(38): 13911-13919 - URL: https://www.wjgnet.com/1007-9327/full/v20/i38/13911.htm
- DOI: https://dx.doi.org/10.3748/wjg.v20.i38.13911


