Copyright
©2014 Baishideng Publishing Group Inc.
World J Gastroenterol. Sep 21, 2014; 20(35): 12542-12550
Published online Sep 21, 2014. doi: 10.3748/wjg.v20.i35.12542
Published online Sep 21, 2014. doi: 10.3748/wjg.v20.i35.12542
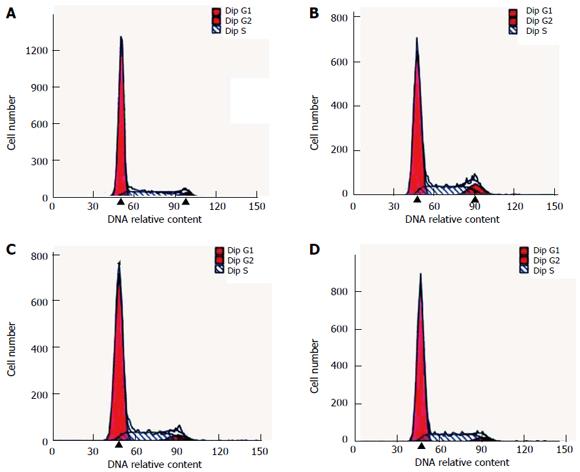
Figure 1 Analysis of cell cycle diagram by flow cytometry.
A: Control group, B: Pentagastrin group; C: Proglumide group; D: Pentagastrin + proglumide group.
- Citation: Mao JD, Wu P, Huang JX, Wu J, Yang G. Role of ERK-MAPK signaling pathway in pentagastrin-regulated growth of large intestinal carcinoma. World J Gastroenterol 2014; 20(35): 12542-12550
- URL: https://www.wjgnet.com/1007-9327/full/v20/i35/12542.htm
- DOI: https://dx.doi.org/10.3748/wjg.v20.i35.12542


