Copyright
©2014 Baishideng Publishing Group Inc.
World J Gastroenterol. Aug 7, 2014; 20(29): 10158-10165
Published online Aug 7, 2014. doi: 10.3748/wjg.v20.i29.10158
Published online Aug 7, 2014. doi: 10.3748/wjg.v20.i29.10158
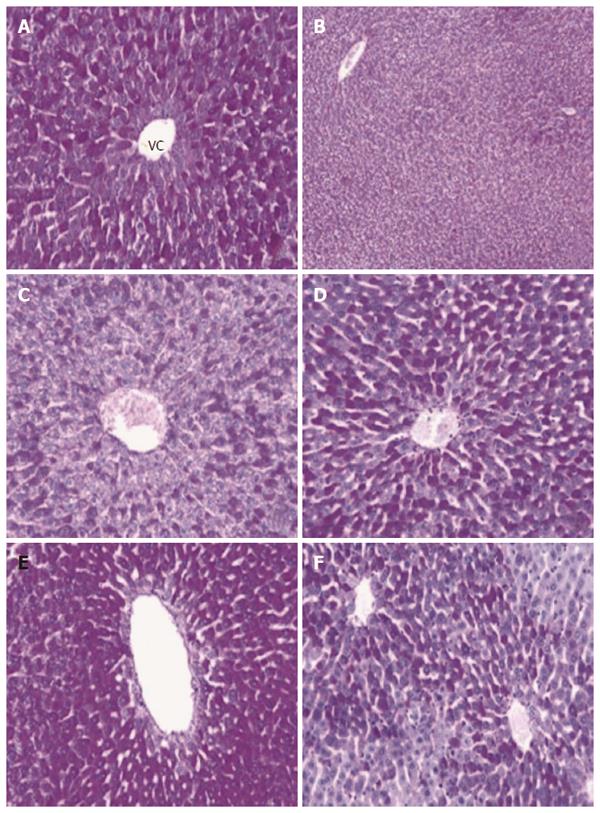
Figure 2 Methotrexate-induced effects on glycogen storage in hepatocytes.
Photomicrographs of representative liver tissues are shown for the control group (A), model group (B, C), and antioxidant treatment groups (D-F). Normal histological appearence of PAS stained control liver tissue showin glycogen within the hepatocytes (magenta color) at × 20 (A). Decreased glycogen storage in hepatocytes is shown in PAS stained model liver tissues at × 10 (B) and × 20 (C) . Differential effects on MTX-reduced glycogen storage are shown in PAS stained liver tissues from the MTX + NAC group at × 20 (D), MTX + AMF group at × 20 (E), and MTX + ASC group at × 20 (F). VC: Vena centralis; MTX: Methotrexate; NAC: N-acetyl cysteine; AMF: Amifostine; ASC: Ascorbic acid; PAS: Periodic acid-Schiff.
- Citation: Akbulut S, Elbe H, Eris C, Dogan Z, Toprak G, Otan E, Erdemli E, Turkoz Y. Cytoprotective effects of amifostine, ascorbic acid and N-acetylcysteine against methotrexate-induced hepatotoxicity in rats. World J Gastroenterol 2014; 20(29): 10158-10165
- URL: https://www.wjgnet.com/1007-9327/full/v20/i29/10158.htm
- DOI: https://dx.doi.org/10.3748/wjg.v20.i29.10158


