Copyright
©2014 Baishideng Publishing Group Inc.
World J Gastroenterol. Aug 7, 2014; 20(29): 10158-10165
Published online Aug 7, 2014. doi: 10.3748/wjg.v20.i29.10158
Published online Aug 7, 2014. doi: 10.3748/wjg.v20.i29.10158
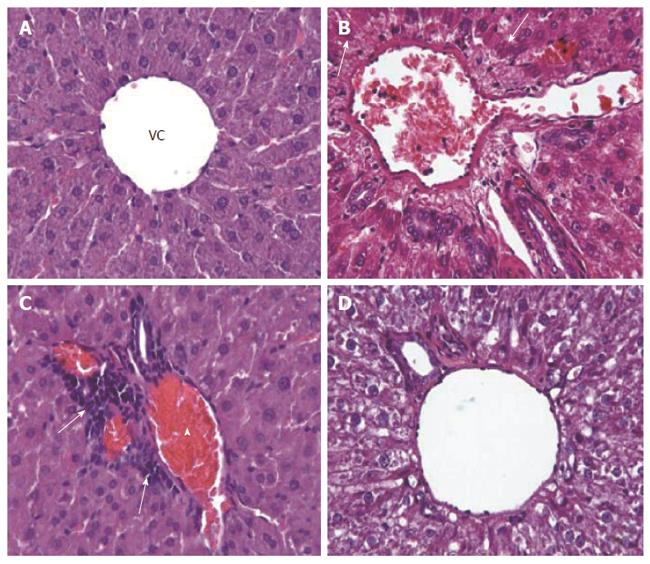
Figure 1 Methotrexate-induced effects on hepatic structure in rats.
Photomicrographs of representative liver tissues are shown for the control group (A) and model group (B-D). A: Normal histological appearence of H-E stained control liver tissues, showing vena centralis (VC) at × 40; B: Abnormal histological appearance of H-E stained model liver tissues, showing hepatocytes with eosinophilic cytoplasm around the portal area (arrows) at × 40; C: Inflammatory cells in the portal area (arrows) and congestion at × 40 (arrowhead); and D: Hydropic degeneration (vacuolization/cellular swelling) in hepatocytes at × 40.
- Citation: Akbulut S, Elbe H, Eris C, Dogan Z, Toprak G, Otan E, Erdemli E, Turkoz Y. Cytoprotective effects of amifostine, ascorbic acid and N-acetylcysteine against methotrexate-induced hepatotoxicity in rats. World J Gastroenterol 2014; 20(29): 10158-10165
- URL: https://www.wjgnet.com/1007-9327/full/v20/i29/10158.htm
- DOI: https://dx.doi.org/10.3748/wjg.v20.i29.10158


