Copyright
©2014 Baishideng Publishing Group Inc.
World J Gastroenterol. Jun 14, 2014; 20(22): 6989-6994
Published online Jun 14, 2014. doi: 10.3748/wjg.v20.i22.6989
Published online Jun 14, 2014. doi: 10.3748/wjg.v20.i22.6989
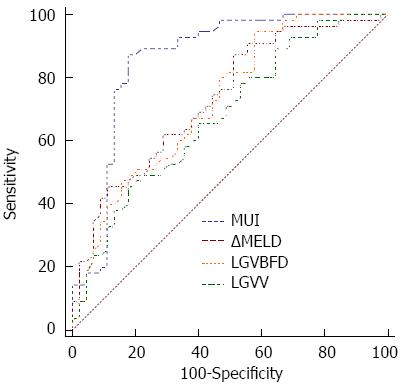
Figure 1 Comparison of the Model for End-Stage Liver Disease-ultrasound-Doppler index to the ΔModel for End-Stage Liver Disease, left gastric vein blood flow velocity and left gastric vein blood flow direction for diagnostic accuracy.
The MELD-US-Doppler Index (MUI) (blue dotted line) had a significantly higher AUC compared to the ΔMELD alone (red dotted line) [0.858 (95%CI: 0.774-0.920) vs 0.734 (95%CI: 0.636-0.817); P < 0.05]. Additionally, the AUC for the MUI was significantly higher than those for the LGVBFD alone (orange dotted line) [0.726 (95%CI: 0.627-0.810); P < 0.05] and the LGVV alone (green dotted line) [0.679 (95%CI: 0.578-0.769); P < 0.05]. AUC: Area under the receiver operating characteristic curve; ΔMELD: The change in the MELD score over a period of three months; LGVBFD: Left gastric vein blood flow direction; LGVV: Left gastric vein blood flow velocity.
- Citation: Xu XD, Dai JJ, Qian JQ, Pin X, Wang WJ. New index to predict esophageal variceal bleeding in cirrhotic patients. World J Gastroenterol 2014; 20(22): 6989-6994
- URL: https://www.wjgnet.com/1007-9327/full/v20/i22/6989.htm
- DOI: https://dx.doi.org/10.3748/wjg.v20.i22.6989


