Copyright
©2014 Baishideng Publishing Group Co.
World J Gastroenterol. May 14, 2014; 20(18): 5511-5518
Published online May 14, 2014. doi: 10.3748/wjg.v20.i18.5511
Published online May 14, 2014. doi: 10.3748/wjg.v20.i18.5511
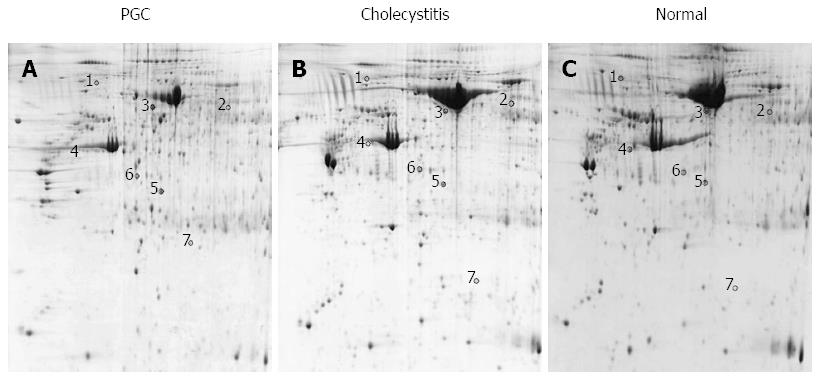
Figure 1 Representative two-dimensional gel electrophoresis protein profiles.
Two-dimensional gel electrophoresis (2-DE) profiles of Primary gallbladder carcinoma (PGC) (A), cholecystitis (B) and normal gallbladder (C) samples. Proteins were separated by pI (X-axis) and molecular mass (Y-axis). Black circles indicate 7 differentially expressed protein spots identified by MALDI-TOF/TOF MS.
- Citation: Huang HL, Yao HS, Wang Y, Wang WJ, Hu ZQ, Jin KZ. Proteomic identification of tumor biomarkers associated with primary gallbladder cancer. World J Gastroenterol 2014; 20(18): 5511-5518
- URL: https://www.wjgnet.com/1007-9327/full/v20/i18/5511.htm
- DOI: https://dx.doi.org/10.3748/wjg.v20.i18.5511


