Copyright
©2013 Baishideng Publishing Group Co.
World J Gastroenterol. Mar 7, 2013; 19(9): 1396-1404
Published online Mar 7, 2013. doi: 10.3748/wjg.v19.i9.1396
Published online Mar 7, 2013. doi: 10.3748/wjg.v19.i9.1396
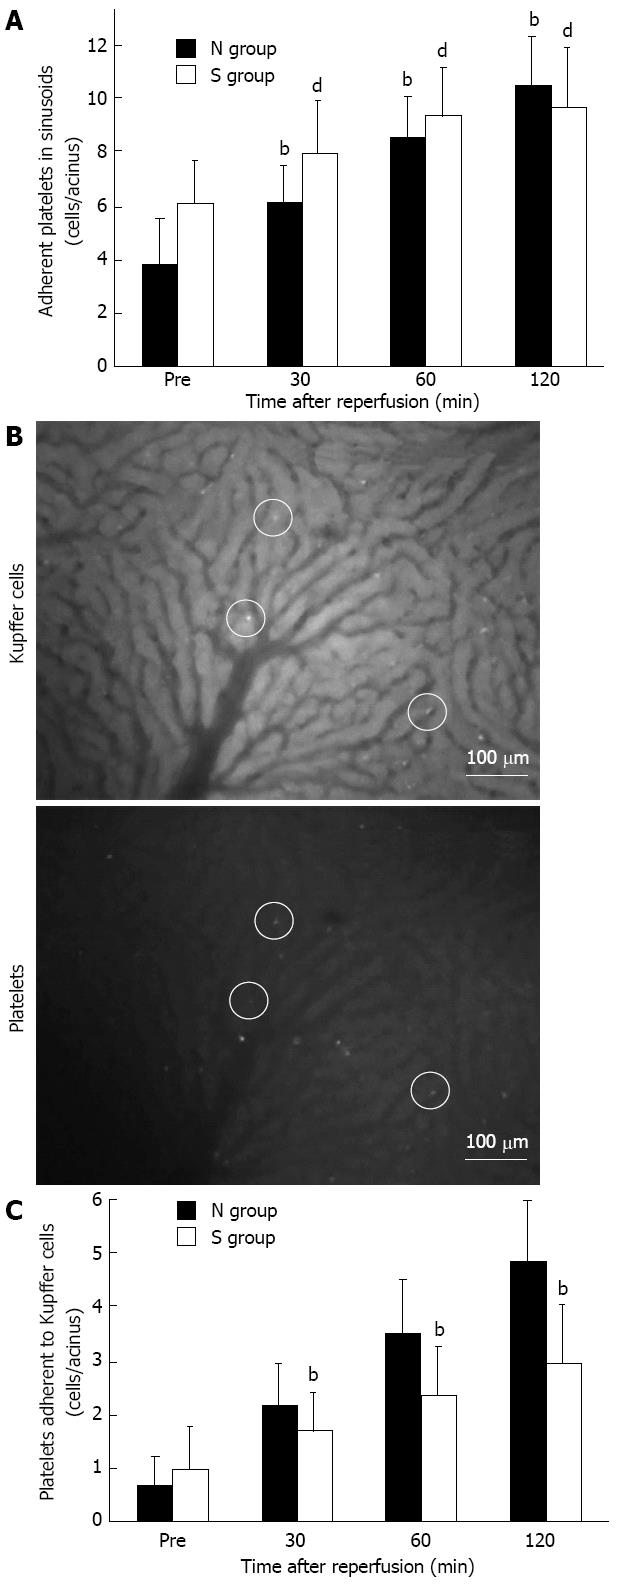
Figure 3 Platelets and Kupffer cell dynamics in sinusoids.
A: The number of adherent platelets in sinusoids increased along with the reperfusion time in both groups. Shown as mean ± SD; n = 6. bP < 0.01 vs pre-ischemia in the normal liver (N) group, dP < 0.01 vs pre-ischemia in the mild steatotic liver (S) group; B: Video images of Kupffer cells (KCs) and platelets in acini 30 min after reperfusion. The field is approximately 0.2 mm2. The upper figure shows the acini of fluorescently stained KCs, and in the lower figure, the acini of fluorescently stained platelets. White circles indicate adhesion to KCs and platelets in the same place; C: In the S group, the number of adherent platelets adhering to KCs was significantly less than in the N group at 30 min after reperfusion and concomitant with the duration of reperfusion. Shown as mean ± SD; n = 6; bP < 0.01 vs the N group.
- Citation: Ogawa K, Kondo T, Tamura T, Matsumura H, Fukunaga K, Oda T, Ohkohchi N. Influence of Kupffer cells and platelets on ischemia-reperfusion injury in mild steatotic liver. World J Gastroenterol 2013; 19(9): 1396-1404
- URL: https://www.wjgnet.com/1007-9327/full/v19/i9/1396.htm
- DOI: https://dx.doi.org/10.3748/wjg.v19.i9.1396


