Copyright
©2013 Baishideng Publishing Group Co.
World J Gastroenterol. Feb 14, 2013; 19(6): 846-854
Published online Feb 14, 2013. doi: 10.3748/wjg.v19.i6.846
Published online Feb 14, 2013. doi: 10.3748/wjg.v19.i6.846
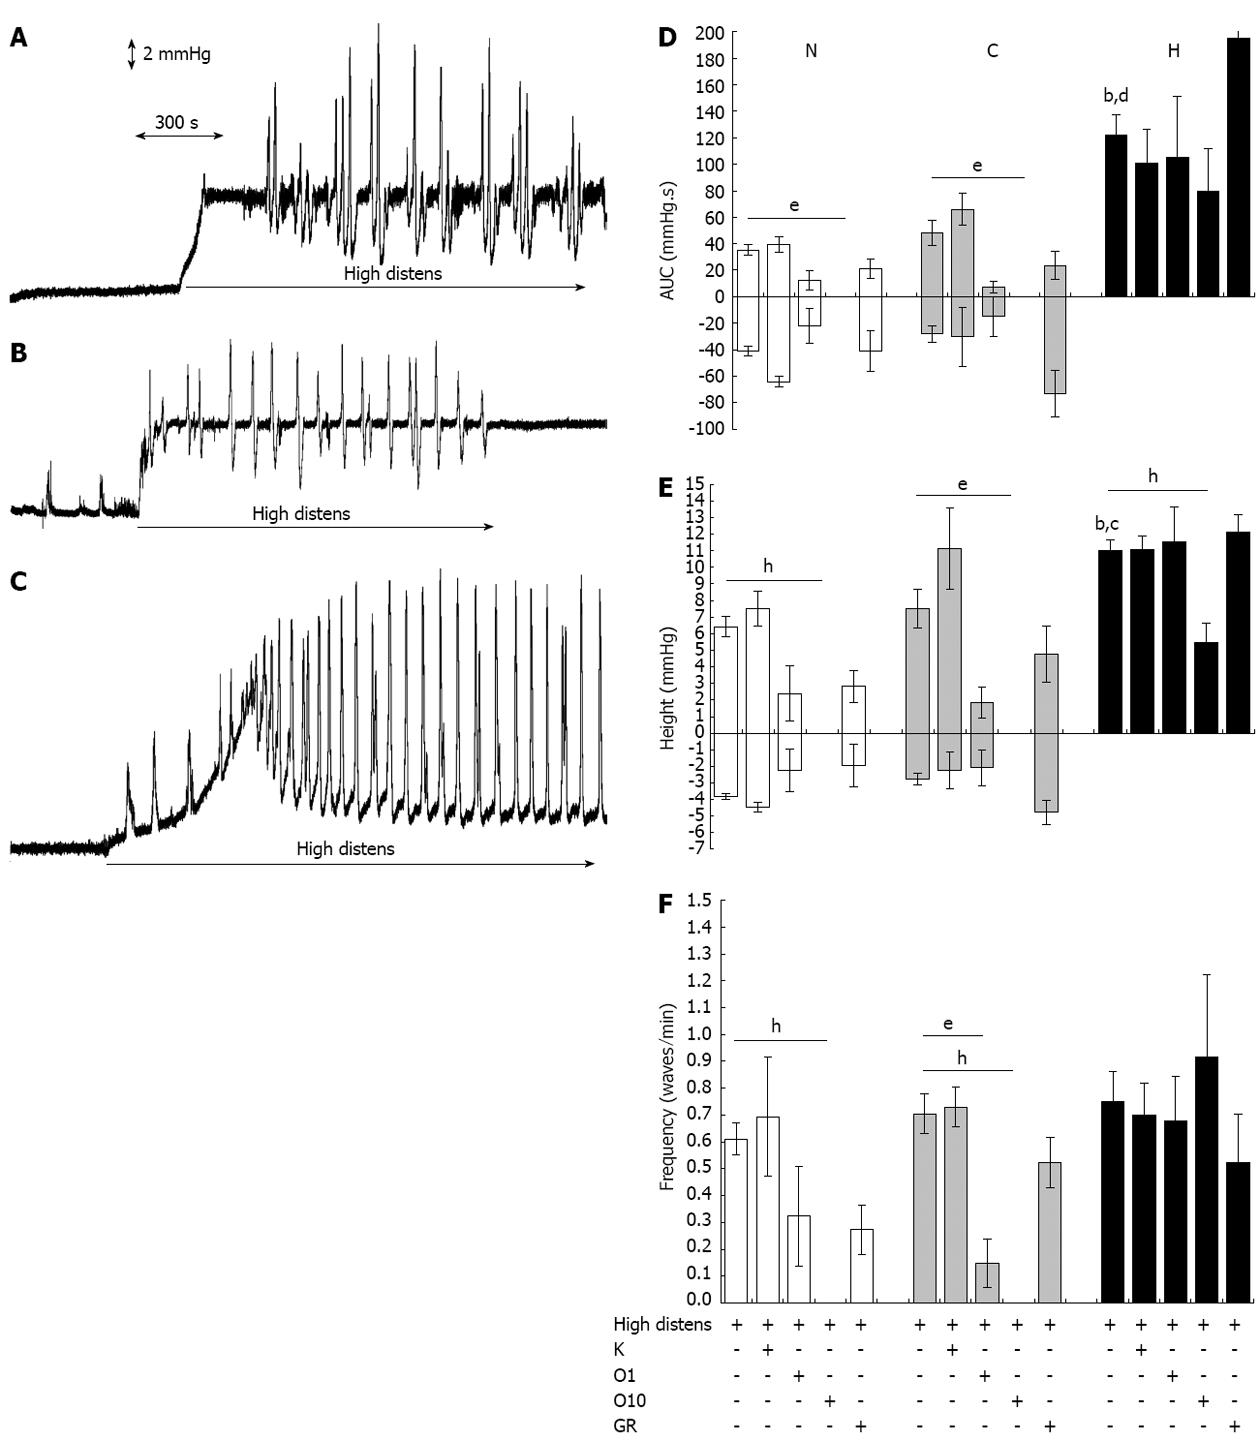
Figure 3 Distension-induced motility.
Original tracings representing changes of intraluminal pressure of ileal segments in basal conditions and following application of a hydrostatic pressure of 8 cm H2O (high distens). A: Normal tissues; B: Control tissues; C: Hypertrophic tissues; D-F: Motor responses in normal (N), control (C) and hypertrophic (H) ileal segments following application of a hydrostatic pressure of 8 cm H2O (high distens) and incubation with ketanserin 1 μmol/L (K), ondansetron 1 (O1) or 10 (O10) μmol/L or GR125487 1 μmol/L (GR). D: Amplitude (area under the pressure-time curve or AUC); E: Height; F: Frequency. Each value is the mean ± SE of 5 distinct experiments per group. bP < 0.001 vs corresponding normal values; cP < 0.05, dP < 0.001 vs corresponding control values; eP < 0.05; hP < 0.01. Analysis of variance test followed by Bonferroni’s post-test.
- Citation: Bertoni S, Saccani F, Gatti R, Rapalli A, Flammini L, Ballabeni V, Barocelli E. Accommodation and peristalsis are functional responses to obstruction in rat hypertrophic ileum. World J Gastroenterol 2013; 19(6): 846-854
- URL: https://www.wjgnet.com/1007-9327/full/v19/i6/846.htm
- DOI: https://dx.doi.org/10.3748/wjg.v19.i6.846


