
















©2013 Baishideng Publishing Group Co.
World J Gastroenterol. Jan 28, 2013; 19(4): 604-606
Published online Jan 28, 2013. doi: 10.3748/wjg.v19.i4.604
Published online Jan 28, 2013. doi: 10.3748/wjg.v19.i4.604
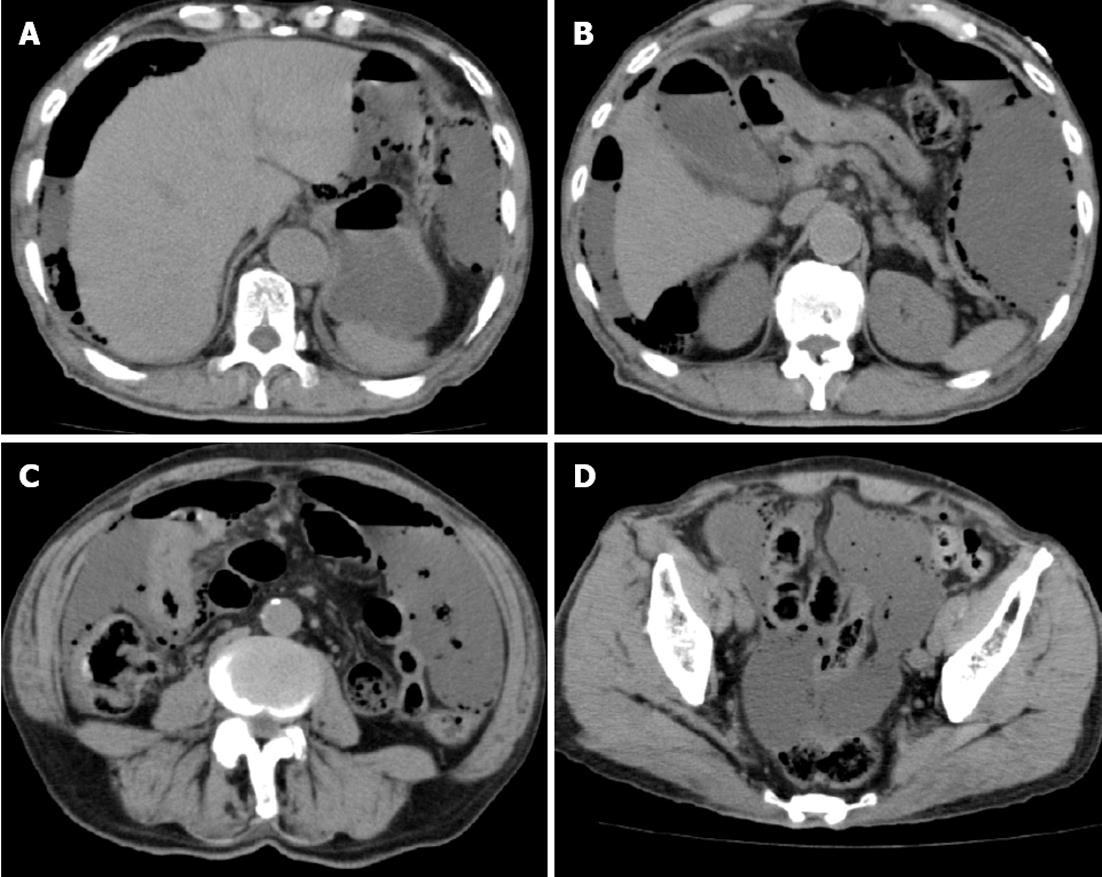
Figure 1 Computed tomography scan (axial axis).
A: Demonstrating massive gas in the abdominal cavity; B: Demonstrating gas inside the gallbladder; C, D: Demonstrating massive ascites as well as a pleural effusion.
- Citation: Miyahara H, Shida D, Matsunaga H, Takahama Y, Miyamoto S. Emphysematous cholecystitis with massive gas in the abdominal cavity. World J Gastroenterol 2013; 19(4): 604-606
- URL: https://www.wjgnet.com/1007-9327/full/v19/i4/604.htm
- DOI: https://dx.doi.org/10.3748/wjg.v19.i4.604