Copyright
©2013 Baishideng Publishing Group Co.
World J Gastroenterol. Oct 21, 2013; 19(39): 6590-6597
Published online Oct 21, 2013. doi: 10.3748/wjg.v19.i39.6590
Published online Oct 21, 2013. doi: 10.3748/wjg.v19.i39.6590
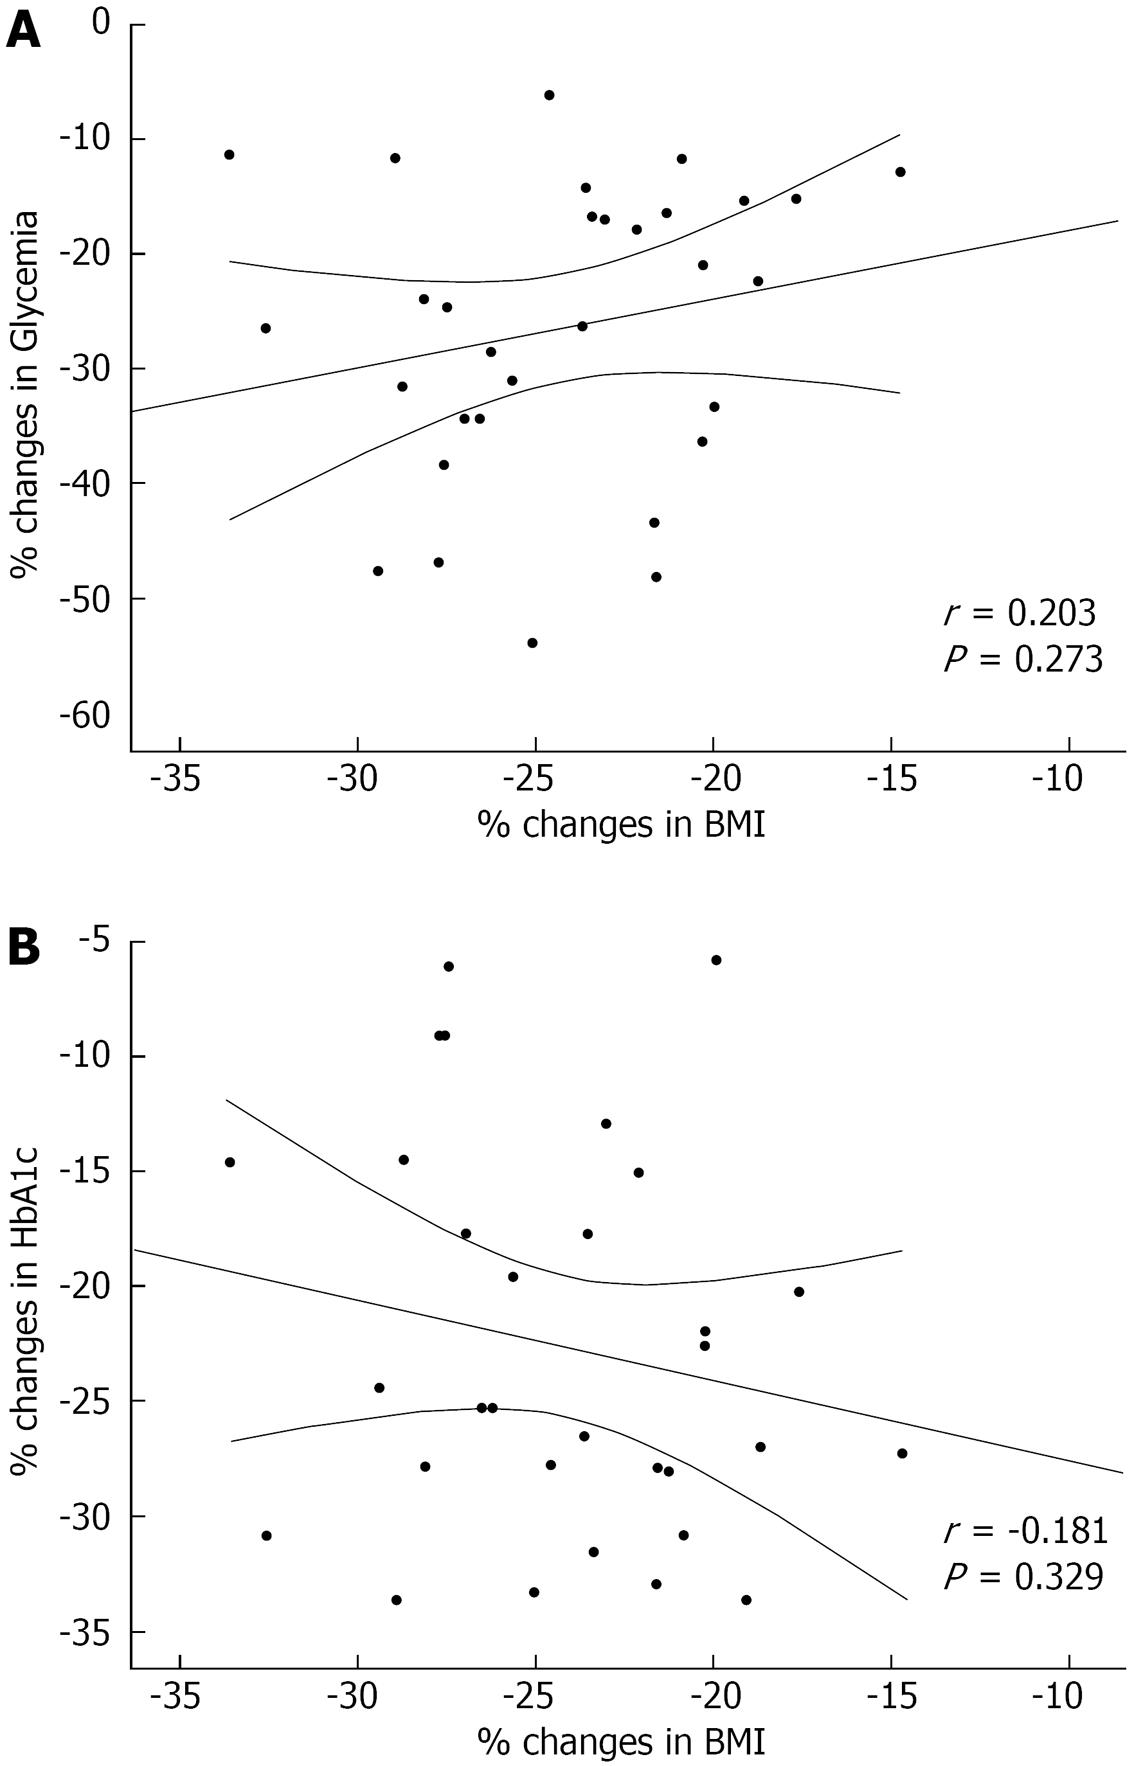
Figure 2 Scatter plot of Pearson’s correlations between the percent change in glycemia and body mass index (A) and in hemoglobin A1c and body mass index (B) following surgical intervention.
HbA1c: Hemoglobin A1c; BMI: Body mass index.
- Citation: Milone M, Di Minno MND, Leongito M, Maietta P, Bianco P, Taffuri C, Gaudioso D, Lupoli R, Savastano S, Milone F, Musella M. Bariatric surgery and diabetes remission: Sleeve gastrectomy or mini-gastric bypass? World J Gastroenterol 2013; 19(39): 6590-6597
- URL: https://www.wjgnet.com/1007-9327/full/v19/i39/6590.htm
- DOI: https://dx.doi.org/10.3748/wjg.v19.i39.6590


