Copyright
©2013 Baishideng Publishing Group Co.
World J Gastroenterol. Oct 7, 2013; 19(37): 6237-6244
Published online Oct 7, 2013. doi: 10.3748/wjg.v19.i37.6237
Published online Oct 7, 2013. doi: 10.3748/wjg.v19.i37.6237
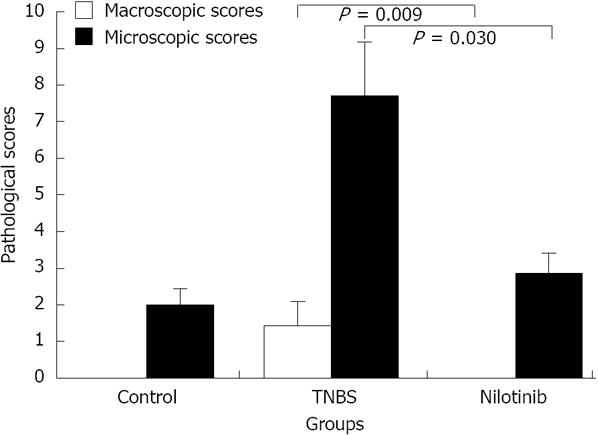
Figure 2 Microscopic and macroscopic pathological scores among the experimental groups.
The results are the mean ± SD. Macroscopic and microscopic pathological scores were similar in the control and nilotinib groups, while the scores in the nilotinib group were significantly lower than those in the trinitrobenzene sulfonic acid (TNBS) group (TNBS vs nilotinib, P = 0.009; TNBS vs nilotinib, P = 0.030).
- Citation: Ataca P, Soyturk M, Karaman M, Unlu M, Sagol O, Dervis Hakim G, Yilmaz O. Nilotinib-mediated mucosal healing in a rat model of colitis. World J Gastroenterol 2013; 19(37): 6237-6244
- URL: https://www.wjgnet.com/1007-9327/full/v19/i37/6237.htm
- DOI: https://dx.doi.org/10.3748/wjg.v19.i37.6237


