Copyright
©2013 Baishideng Publishing Group Co.
World J Gastroenterol. Oct 7, 2013; 19(37): 6237-6244
Published online Oct 7, 2013. doi: 10.3748/wjg.v19.i37.6237
Published online Oct 7, 2013. doi: 10.3748/wjg.v19.i37.6237
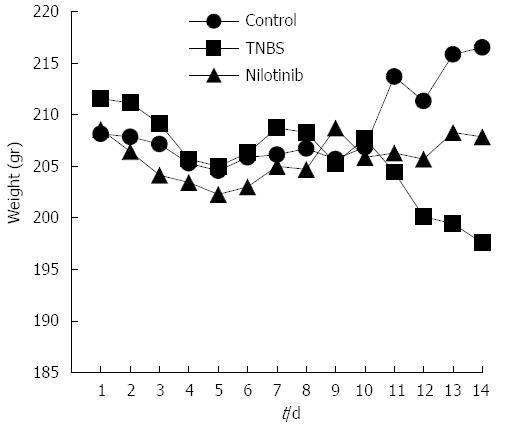
Figure 1 Trends of weight changes among the experimental groups.
Control group (circle), Trinitrobenzene sulfonic acid (TNBS) group (square), and nilotinib group (triangle). The TNBS group lost an average weight of 14 g, while the nilotinib group lost 0.7 g in 14 d (P = 0.047). The nilotinib group gained an average weight of 2.9 g between day 7 and day 14, while the TNBS group lost an average weight of 11.1 g (P = 0.015).
- Citation: Ataca P, Soyturk M, Karaman M, Unlu M, Sagol O, Dervis Hakim G, Yilmaz O. Nilotinib-mediated mucosal healing in a rat model of colitis. World J Gastroenterol 2013; 19(37): 6237-6244
- URL: https://www.wjgnet.com/1007-9327/full/v19/i37/6237.htm
- DOI: https://dx.doi.org/10.3748/wjg.v19.i37.6237


