Copyright
©2013 Baishideng Publishing Group Co.
World J Gastroenterol. Aug 28, 2013; 19(32): 5250-5260
Published online Aug 28, 2013. doi: 10.3748/wjg.v19.i32.5250
Published online Aug 28, 2013. doi: 10.3748/wjg.v19.i32.5250
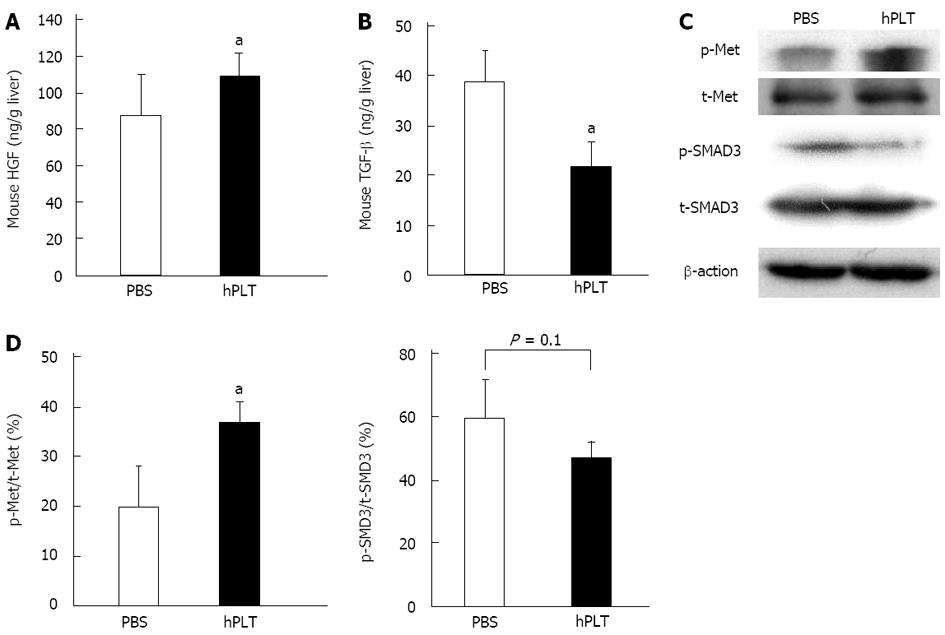
Figure 5 Mouse hepatocyte growth factor and transforming growth factor-β in liver tissue and cellular signal transductions.
A: Mouse hepatocyte growth factor (HGF) concentrations in liver tissue. n = 8 per group. Data are expressed as the means ± SD. aP < 0.05 for the human platelet transfusions (hPLT) group vs the phosphate-buffered saline (PBS) group using an unpaired t-test. Mouse HGF expression was significantly higher in the hPLT group than in the PBS group; B: Mouse transforming growth factor-β (TGF-β) concentrations in liver tissue. n = 8 per group. Data are expressed as the mean ± SD. aP < 0.05 using an unpaired t-test. Mouse TGF-β expression was significantly lower in the hPLT group than in the PBS group; C: Phosphorylation of mesenchymal-epithelial transition factor (Met) and SMAD3 in the PBS and hPLT groups. Met was more highly phosphorylated in the hPLT group than in the PBS group, whereas phosphorylation of SMAD3 was weaker in the hPLT group than in the PBS group; D: Met and SMAD3 phosphorylation levels were quantified using densitometry. n = 3 per group. Data are expressed as the mean ± SD. aP < 0.05 using an unpaired t-test. Phosphorylation of Met was significantly higher in the hPLT group than in the PBS group. Although the difference was not statistically significant, phosphorylation of SMAD3 tended to be lower in the hPLT group than in the PBS group.
- Citation: Takahashi K, Murata S, Fukunaga K, Ohkohchi N. Human platelets inhibit liver fibrosis in severe combined immunodeficiency mice. World J Gastroenterol 2013; 19(32): 5250-5260
- URL: https://www.wjgnet.com/1007-9327/full/v19/i32/5250.htm
- DOI: https://dx.doi.org/10.3748/wjg.v19.i32.5250


