Copyright
©2013 Baishideng Publishing Group Co.
World J Gastroenterol. Jul 14, 2013; 19(26): 4146-4154
Published online Jul 14, 2013. doi: 10.3748/wjg.v19.i26.4146
Published online Jul 14, 2013. doi: 10.3748/wjg.v19.i26.4146
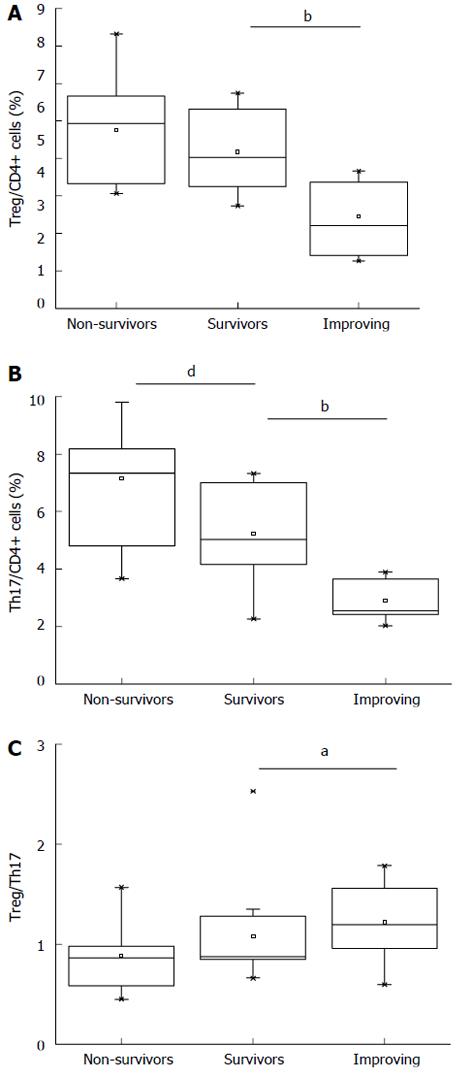
Figure 3 Comparison of regulatory T cells and T helper 17 cell counts, and the regulatory T cell to T helper 17 cell ratio between acute-on-chronic liver failure survivors and non-survivors, as well as those during the peak of acute-on-chronic liver failure severity (total bilirubin peak) and those during the 8th week of follow-up.
Regulatory T (Treg) cell counts (A), T helper 17 (Th17) cell counts (B), and the Treg cell to Th17 cell ratios (C) of acute-on-chronic liver failure (ACLF) non-survivors, as well as those of ACLF survivors during the total bilirubin (TBIL) peak and during the 8th week of follow-up. aP < 0.05, bP < 0.01 vs the 8th week of follow-up in ACLF survivors, dP < 0.01 vs non-survivors. Non-survivors: The non-survivors in ACLF group; Survivors: The survivors in ACLF group during the TBIL peak; Improving: The survivors in ACLF group during the 8th week of follow-up.
- Citation: Niu YH, Yin DL, Liu HL, Yi RT, Yang YC, Xue HA, Chen TY, Zhang SL, Lin SM, Zhao YR. Restoring the Treg cell to Th17 cell ratio may alleviate HBV-related acute-on-chronic liver failure. World J Gastroenterol 2013; 19(26): 4146-4154
- URL: https://www.wjgnet.com/1007-9327/full/v19/i26/4146.htm
- DOI: https://dx.doi.org/10.3748/wjg.v19.i26.4146


