Copyright
©2013 Baishideng Publishing Group Co.
World J Gastroenterol. Jul 14, 2013; 19(26): 4146-4154
Published online Jul 14, 2013. doi: 10.3748/wjg.v19.i26.4146
Published online Jul 14, 2013. doi: 10.3748/wjg.v19.i26.4146
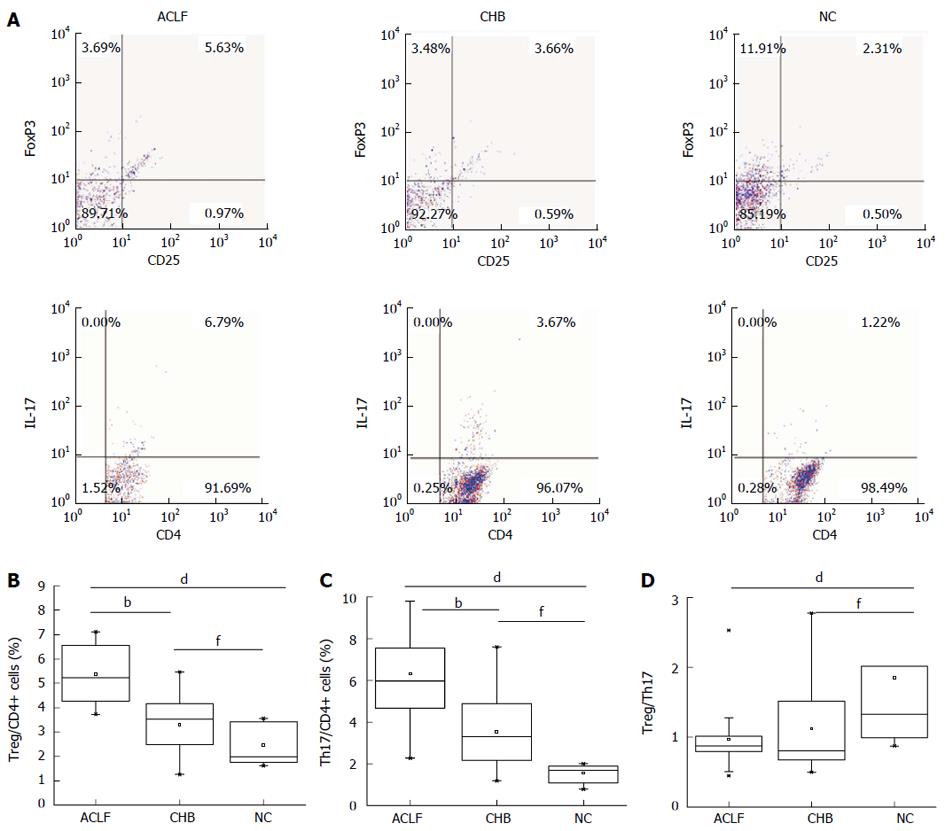
Figure 1 Percentages of T helper 17 cells and regulatory T cells, and the ratio of regulatory T cells to T helper 17 cells in hepatitis B virus-related acute-on-chronic liver failure, chronic hepatitis B, and normal control groups.
Typical four-quadrant graphs of CD25+FoxP3+ cells [regulatory T (Treg)] and IL17+ cells [T helper 17 (Th17)] in CD4+ cells were divided into three groups (A). The proportion of Treg cells (B) and Th17 cells (C) among CD4+ cells, and the Treg cell to Th17 cell ratios (D) were shown as box plot graphs. Acute-on-chronic liver failure (ACLF) vs chronic hepatitis B group (CHB) bP < 0.01; ACLF vs normal control group (NC) dP < 0.01; CHB vs NC fP < 0.01.
- Citation: Niu YH, Yin DL, Liu HL, Yi RT, Yang YC, Xue HA, Chen TY, Zhang SL, Lin SM, Zhao YR. Restoring the Treg cell to Th17 cell ratio may alleviate HBV-related acute-on-chronic liver failure. World J Gastroenterol 2013; 19(26): 4146-4154
- URL: https://www.wjgnet.com/1007-9327/full/v19/i26/4146.htm
- DOI: https://dx.doi.org/10.3748/wjg.v19.i26.4146


