Copyright
©2013 Baishideng Publishing Group Co.
World J Gastroenterol. Jun 14, 2013; 19(22): 3520-3523
Published online Jun 14, 2013. doi: 10.3748/wjg.v19.i22.3520
Published online Jun 14, 2013. doi: 10.3748/wjg.v19.i22.3520
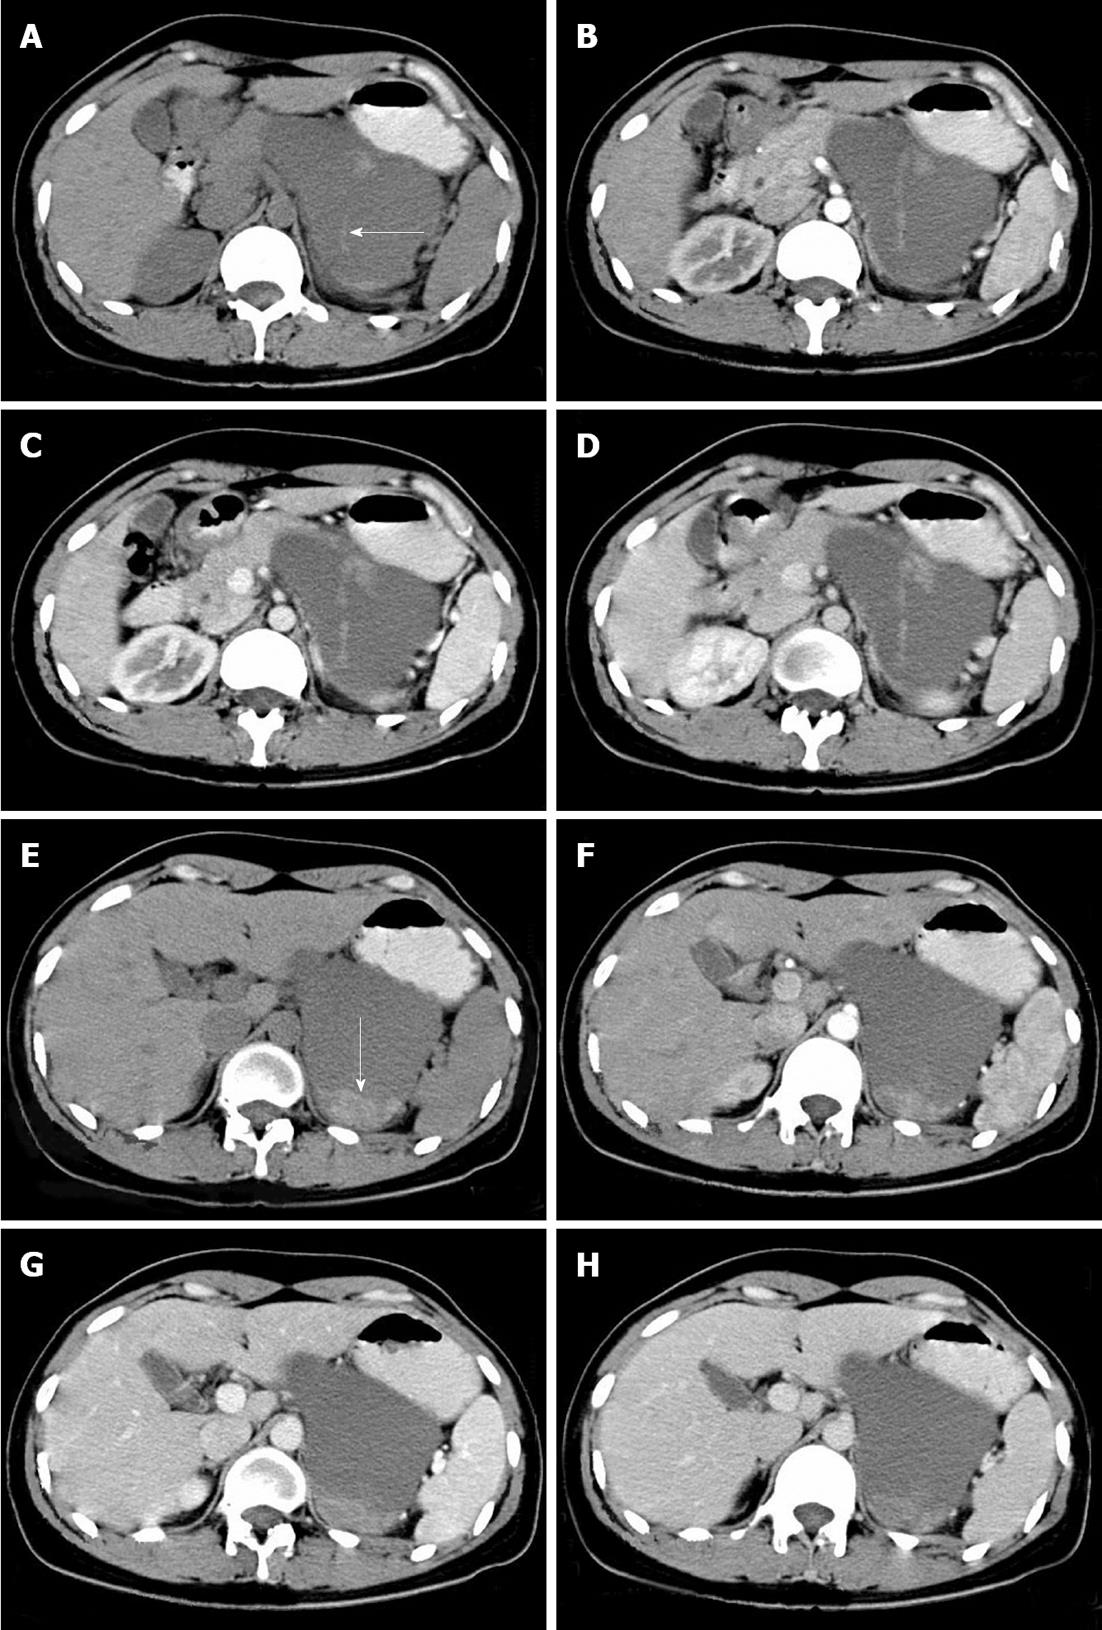
Figure 2 Computed tomography images.
A-D: There is a septum (arrow) in the center of the cystic part. Neither the cystic part nor the septum shows enhancement in the arterial phase (20 s after contrast injection) (B), pancreatic phase (45 s after contrast injection) (C), or portal phase (80 s after contrast injection) (D) compared with the pre-enhanced phase (A); E-H: The solid part (arrow) shows no enhancement in the arterial phase (20 s after contrast injection) (F), pancreatic phase (45 s after contrast injection) (G), or portal phase (80 s after contrast injection) (H) compared with the pre-enhanced phase (E).
- Citation: Dong F, Zheng Y, Wu JJ, Fu YB, Jin K, Chao M. Hemolymphangioma: A rare differential diagnosis of cystic-solid or cystic tumors of the pancreas. World J Gastroenterol 2013; 19(22): 3520-3523
- URL: https://www.wjgnet.com/1007-9327/full/v19/i22/3520.htm
- DOI: https://dx.doi.org/10.3748/wjg.v19.i22.3520


