Copyright
©2013 Baishideng Publishing Group Co.
World J Gastroenterol. May 21, 2013; 19(19): 2913-2920
Published online May 21, 2013. doi: 10.3748/wjg.v19.i19.2913
Published online May 21, 2013. doi: 10.3748/wjg.v19.i19.2913
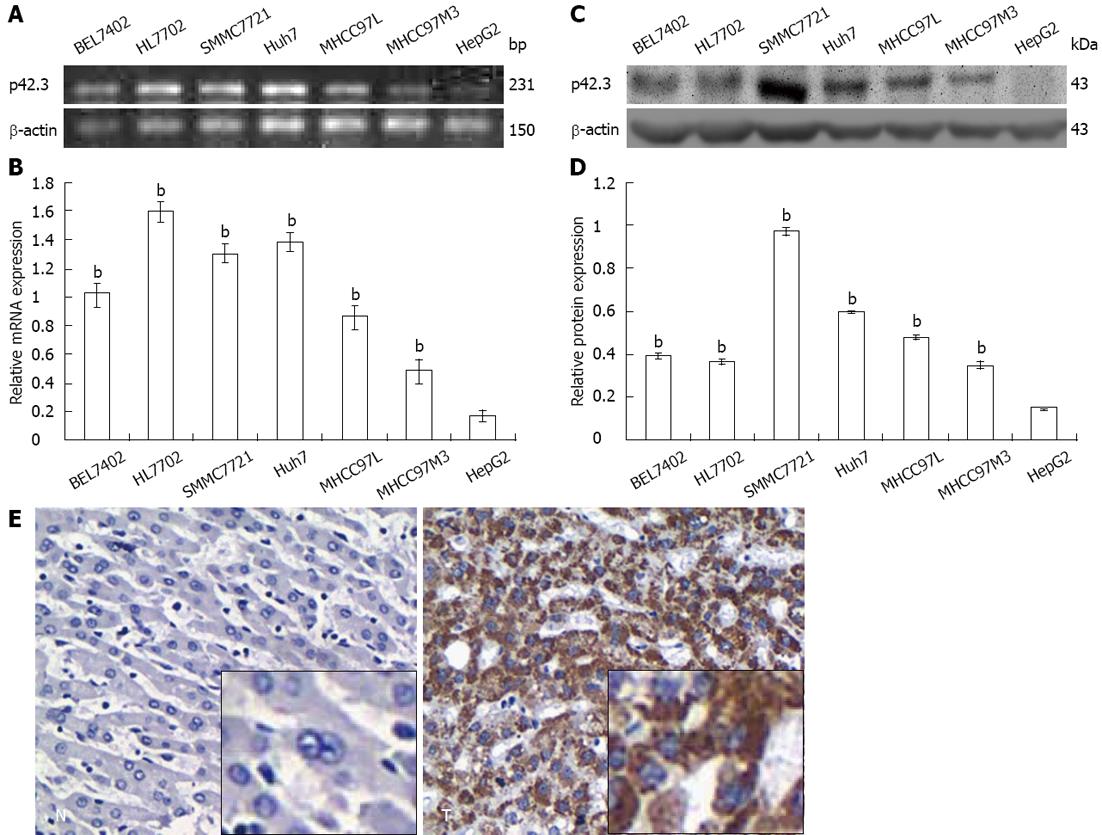
Figure 1 Detection of p42.
3 in hepatic cell lines and hepatocellular carcinoma tissues. A: Reverse transcription-polymerase chain reaction (RT-PCR) analysis showed that p42.3 was detectable in all 7 cell lines, and the lowest expression was in HepG2 cells; B: Relative expression of p42.3 mRNA in seven hepatic cell lines using quantitative real-time RT-PCR. Data are shown as the mean ± SD, endogenous references was β-actin (bP < 0.01 vs HepG2); C and D: Expression of p42.3 protein in hepatic cell lines analyzed by Western blotting (C) and shown as mean ± SD (D) (bP < 0.01 vs HepG2); E: Negative staining of p42.3 in hepatocellular carcinoma-adjacent normal tissue (left), positive staining of p42.3 in tumor (right). Original magnification, × 100; the inset boxes are at original magnification × 200.
- Citation: Sun W, Dong WW, Mao LL, Li WM, Cui JT, Xing R, Lu YY. Overexpression of p42.3 promotes cell growth and tumorigenicity in hepatocellular carcinoma. World J Gastroenterol 2013; 19(19): 2913-2920
- URL: https://www.wjgnet.com/1007-9327/full/v19/i19/2913.htm
- DOI: https://dx.doi.org/10.3748/wjg.v19.i19.2913


