Copyright
©2013 Baishideng Publishing Group Co.
World J Gastroenterol. May 21, 2013; 19(19): 2894-2903
Published online May 21, 2013. doi: 10.3748/wjg.v19.i19.2894
Published online May 21, 2013. doi: 10.3748/wjg.v19.i19.2894
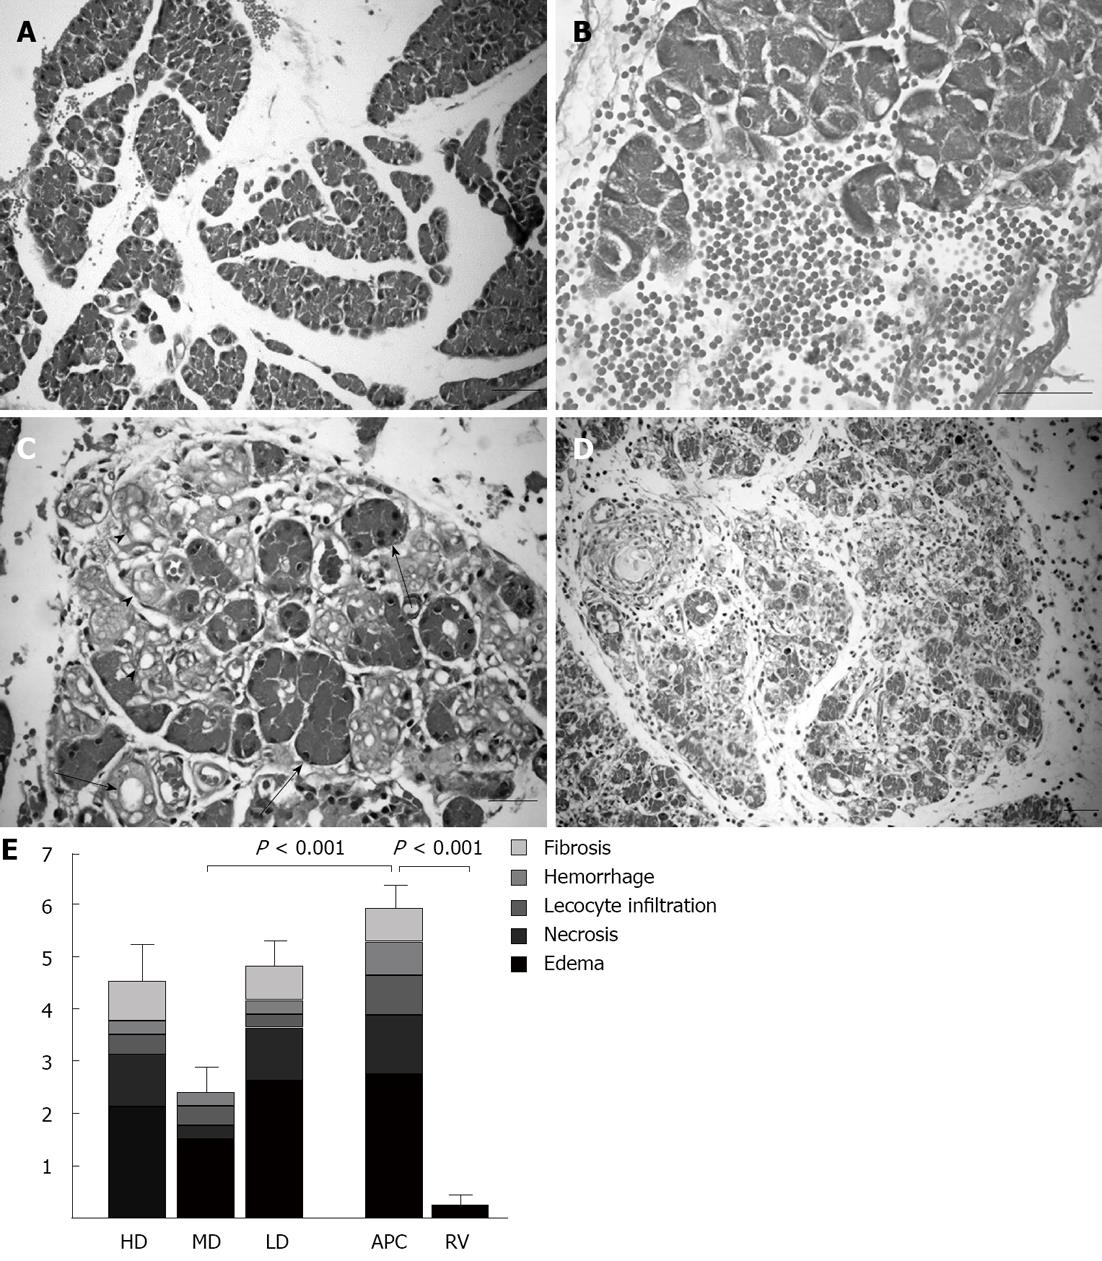
Figure 2 Histopathological alterations in rat pancreas caused by cerulein-induced acute pancreatitis and histopathological scores.
A: Pancreatic acini were separated because of interlobular edema in cerulein treated animals (bar = 100 μm); B: Occasionally mild hemorrhages were observed (bar = 50 μm); C: Several acinar cells lost their zymogen granules (arrows) and ductus-like structures (arrowheads) occurred (bar = 50 μm); D: In some animals, leucocyte, fibrocyte and fibroblast infiltrations and collagen bands were detected (bar = 200 μm); E: Histopathological scores of each group are shown as stacked columns representing means. The whole column corresponds to the mean of the total score and the error bars represent the SEM of the total score. All groups are compared with the APC group and the statistical significance is expressed as a vertical P value over the column. HD: High-dose; MD: Medium-dose; LD: Low-dose; APC: Acute pancreatitis control; RV: Reference values.
- Citation: Akyazi I, Eraslan E, Gülçubuk A, Ekiz EE, Çırakli ZL, Haktanir D, Bala DA, Özkurt M, Matur E, Özcan M. Long-term aspirin pretreatment in the prevention of cerulein-induced acute pancreatitis in rats. World J Gastroenterol 2013; 19(19): 2894-2903
- URL: https://www.wjgnet.com/1007-9327/full/v19/i19/2894.htm
- DOI: https://dx.doi.org/10.3748/wjg.v19.i19.2894


