Copyright
©2013 Baishideng Publishing Group Co.
World J Gastroenterol. May 21, 2013; 19(19): 2894-2903
Published online May 21, 2013. doi: 10.3748/wjg.v19.i19.2894
Published online May 21, 2013. doi: 10.3748/wjg.v19.i19.2894
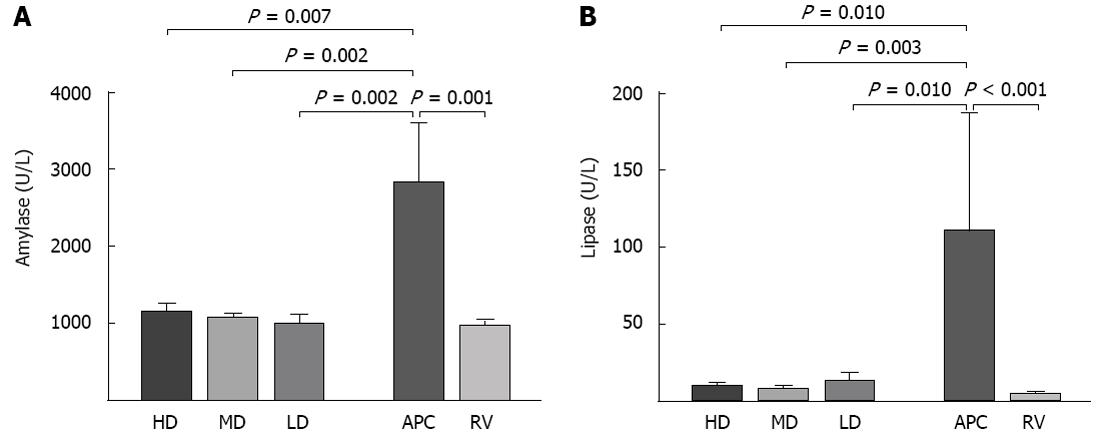
Figure 1 Plasma amylase (A) and lipase (B) activities.
Columns show the mean and the error bars represent SEM. All groups are compared with the acute pancreatitis control (APC) group and the statistical significance is expressed as a vertical P value over the column. LD: Low-dose; MD: Medium-dose; HD: High-dose; RV: Reference values.
- Citation: Akyazi I, Eraslan E, Gülçubuk A, Ekiz EE, Çırakli ZL, Haktanir D, Bala DA, Özkurt M, Matur E, Özcan M. Long-term aspirin pretreatment in the prevention of cerulein-induced acute pancreatitis in rats. World J Gastroenterol 2013; 19(19): 2894-2903
- URL: https://www.wjgnet.com/1007-9327/full/v19/i19/2894.htm
- DOI: https://dx.doi.org/10.3748/wjg.v19.i19.2894


