Copyright
©2012 Baishideng Publishing Group Co.
World J Gastroenterol. Feb 28, 2012; 18(8): 794-799
Published online Feb 28, 2012. doi: 10.3748/wjg.v18.i8.794
Published online Feb 28, 2012. doi: 10.3748/wjg.v18.i8.794
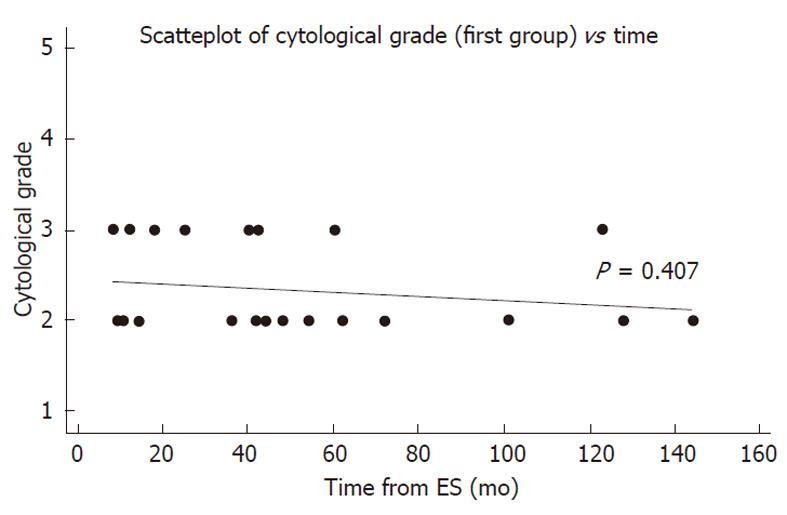
Figure 2 Scatterplot with regression of the cytological evaluation of the first group vs time (mo) after endoscopic sphincterotomy.
The cytological grade is according to Table 2. 3: Atypical/indeterminate sample; 2: Negative for malignancy sample. ES: Endoscopic sphincterotomy. (Figure design was prepared with Minitab 16 Statistical software).
- Citation: Kalaitzis J, Vezakis A, Fragulidis G, Anagnostopoulou I, Rizos S, Papalambros E, Polydorou A. Effects of endoscopic sphincterotomy on biliary epithelium: A case-control study. World J Gastroenterol 2012; 18(8): 794-799
- URL: https://www.wjgnet.com/1007-9327/full/v18/i8/794.htm
- DOI: https://dx.doi.org/10.3748/wjg.v18.i8.794


