Copyright
©2012 Baishideng Publishing Group Co.
World J Gastroenterol. Feb 14, 2012; 18(6): 557-562
Published online Feb 14, 2012. doi: 10.3748/wjg.v18.i6.557
Published online Feb 14, 2012. doi: 10.3748/wjg.v18.i6.557
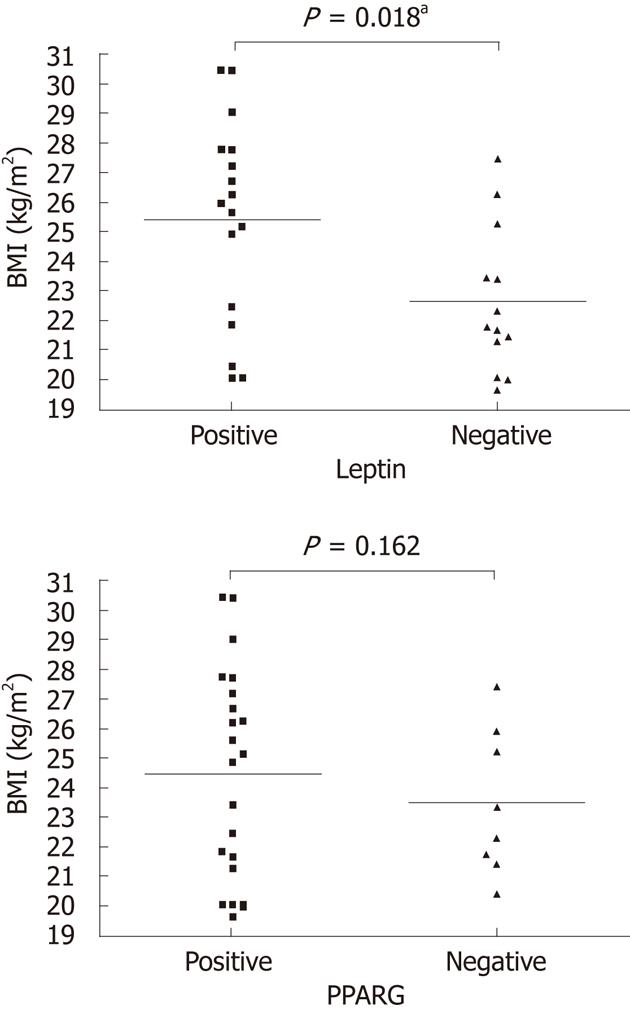
Figure 2 Leptin and peroxisome-proliferator-activated receptor γ expression in colorectal adenomas and body mass index.
A: The body mass index (BMI) of leptin positive group (25.4 ± 3.4 kg/m2) was significantly higher than the BMI of leptin negative group (22.6 ± 2.4 kg/m2, P = 0.018); B: There is no significant difference between the BMI of peroxisome-proliferator-activated receptor γ (PPARG) positive group (24.47 ± 0.75 kg/m2) and PPARG negative group (23.52 ± 0.87 kg/m2, P = 0.162).
- Citation: Kim HH, Kim YS, Kang YK, Moon JS. Leptin and peroxisome proliferator-activated receptor γ expression in colorectal adenoma. World J Gastroenterol 2012; 18(6): 557-562
- URL: https://www.wjgnet.com/1007-9327/full/v18/i6/557.htm
- DOI: https://dx.doi.org/10.3748/wjg.v18.i6.557


