Copyright
©2012 Baishideng Publishing Group Co.
World J Gastroenterol. Oct 14, 2012; 18(38): 5404-5411
Published online Oct 14, 2012. doi: 10.3748/wjg.v18.i38.5404
Published online Oct 14, 2012. doi: 10.3748/wjg.v18.i38.5404
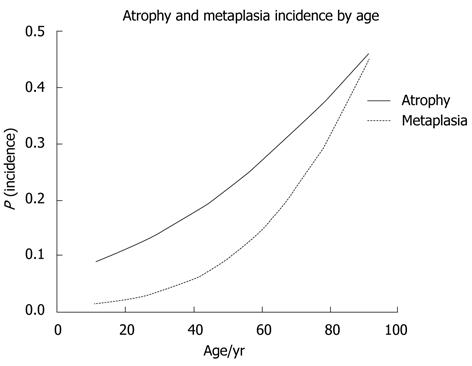
Figure 3 Logistic regression curves of age as an independent factor to explain atrophy and intestinal metaplasia incidences.
All patients who underwent endoscopy and who had at least one of the three diseases were included in the analysis. Both models had highly significant fits (atrophy OR = 1.0297, P < 0.0001; intestinal metaplasia OR = 3.6077, P < 0.0001). OR: Odds ratios.
- Citation: Suzuki RB, Cola RF, Cola LTB, Ferrari CG, Ellinger F, Therezo AL, Silva LC, Eterovic A, Sperança MA. Different risk factors influence peptic ulcer disease development in a Brazilian population. World J Gastroenterol 2012; 18(38): 5404-5411
- URL: https://www.wjgnet.com/1007-9327/full/v18/i38/5404.htm
- DOI: https://dx.doi.org/10.3748/wjg.v18.i38.5404


