Copyright
©2012 Baishideng Publishing Group Co.
World J Gastroenterol. May 14, 2012; 18(18): 2262-2269
Published online May 14, 2012. doi: 10.3748/wjg.v18.i18.2262
Published online May 14, 2012. doi: 10.3748/wjg.v18.i18.2262
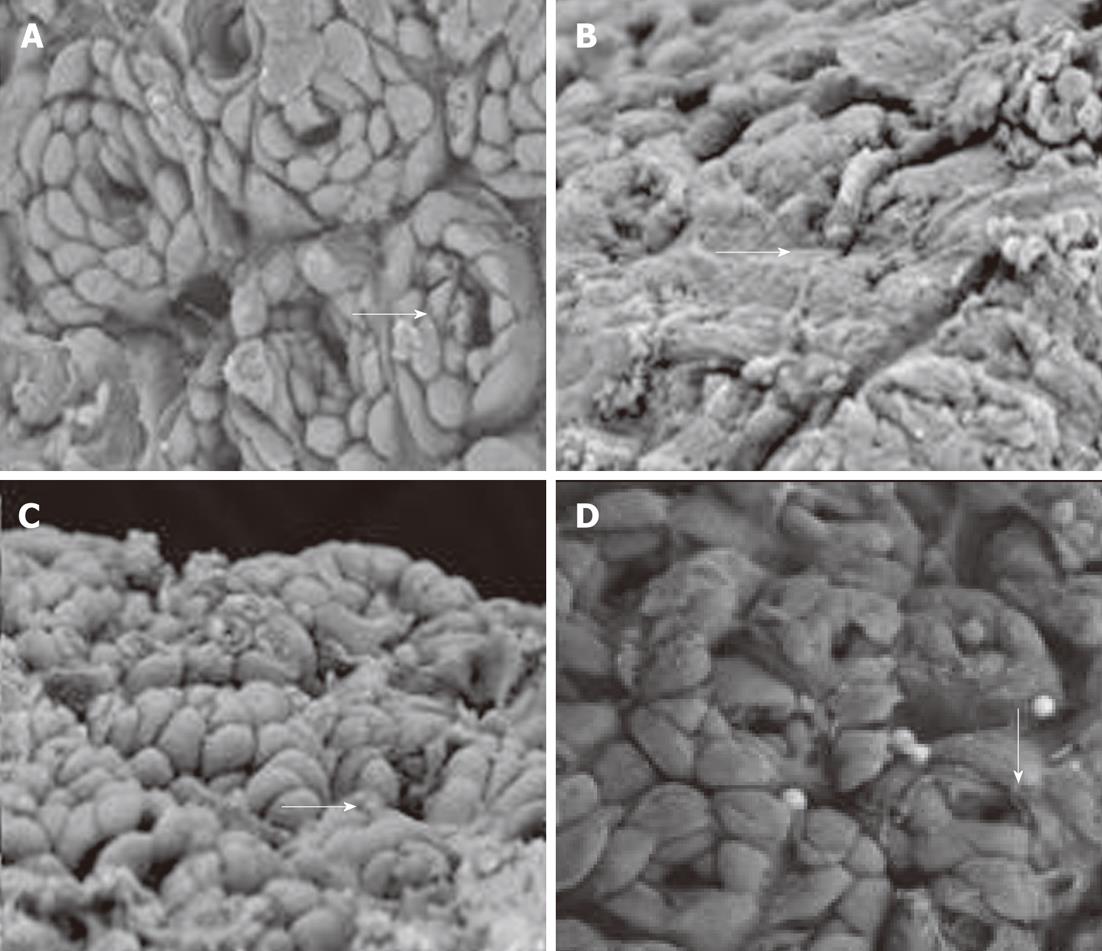
Figure 3 Ultrastructural changes under scanning electron microscopy.
A: Normal control group: Epithelial cells were closely joined and ringwise arranged around the gastric gland openings (arrow), the gastric pits were clear with ordered cells (× 2500); B: Model control group: extensive gastric epithelial cell loss, disappearance of gastric pits (arrow), and revealed glandular epithelium (× 2500); C: Low-dose geranylgeranylacetone treated group: the gastric epithelial cells showed basically complete structure and fewer ruptured epithelial cells (arrow, × 2500); D: High-dose geranylgeranylacetone treated group: the gastric epithelial cells showed relatively perfect structure and fewer ruptured epithelial cells (arrow, × 2500).
- Citation: Ning JW, Lin GB, Ji F, Xu J, Sharify N. Preventive effects of geranylgeranylacetone on rat ethanol-induced gastritis. World J Gastroenterol 2012; 18(18): 2262-2269
- URL: https://www.wjgnet.com/1007-9327/full/v18/i18/2262.htm
- DOI: https://dx.doi.org/10.3748/wjg.v18.i18.2262


